


Introduction
Inflammatory bowel diseases like Crohn’s disease (CD) or ulcerative colitis represent a group of chronic conditions characterised by periods of flare-ups and remissions.
Currently, different methods are used to assess the activity of the disease, including the following: Crohn’s Disease Activity Index (CDAI), inflammatory biomarkers, and medical imaging, which shows the severity of inflammatory changes.
Crohn’s Disease Activity Index is considered the gold standard for assessing the clinical condition of patients. According to ECCO guidelines, a CDAI score < 150.0 points indicates a remission, whereas a CDAI score > 220.0 points indicates disease exacerbation [1]. Biomarkers used in laboratory tests include the following: C-reactive protein (CRP), haemoglobin, leukocytes, thrombocytes, serum iron, ferritin, ceruloplasmin, α1-antitripsin, plasminogen, fibrinogen, interleukin 6, salicylic acid, and amyloid A [2]. Faecal biomarkers include: faecal calprotectin (FC), faecal lactoferrin (FL), elastase, myeloperoxidase, metalloproteinase 9, and neoprotein [3].
CRP, a protein produced by hepatocytes [4], is not characteristic solely of inflammatory bowel disease (IBD). The CRP level is elevated in other inflammatory diseases as well [4, 5].
There is a correlation between elevated CRP levels and the clinical activity of CD [6–8]; however, in 20.0–25.0% of patients with severe CD, there is no increase in the CRP level due to a single-nucleotide polymorphism in the CRP gene [9].
Faecal calprotectin is an inflammatory protein found in the cytosol of human neutrophils, macrophages, and monocytes [10–12]. When inflammation is present, the FC level is in direct proportion to the migration of neutrophils to the digestive tract. This is the reason for increased levels of FC in the case of inflammatory diseases of the digestive tract in general. FC has already been adapted in clinical practice in Western Europe as a surrogate marker for intestinal inflammation. It correlates strongly with endoscopic scores of activity [5, 13–18], and from an economic point of view it is cheaper, faster, and more patient friendly than the standard endoscopic procedures [15].
Magnetic resonance enterography (MRE), an examination used for visualising small intestine damage, is an important complementary test to colonoscopy. Along with biochemical endoscopic assessments, MRE is used to diagnose and assess the activity of inflammatory bowel disease (IBD); nevertheless, ileocolonoscopy with biopsy remains the first-line diagnostic tool [16–18]. MRE and computed tomography enterography (CTE) are imaging techniques used to investigate intramural changes and complications of CD [19–21].
MRE is recommended by ECCO, not only as a diagnostic tool, but also as a monitoring tool in patients with CD [17, 18]. A comparison study conducted to evaluate the diagnostic value of MRE and ileocolonoscopy in monitoring the response to treatment in patients with CD showed that both methods have a similar degree of reliability when it comes to assessing the healing of changes (90.0% vs. 83.0%) [22].
Colonoscopy is a recommended method for assessing disease activity in the large intestine and the distal segment of the ileum. Currently, two methods are applied to assess the inflammation: SES-CD (simple endoscopic score index) and CDEIS (Crohn’s disease index of severity) [23]. Both methods involve the use of video colonoscopy. The study described in this article was performed to assess and compare methods used for the assessment of inflammation activity in CD, such as: blood and faecal biomarkers, imaging techniques, and clinical assessment based on CDAI.
Aim
The aim of the study was to determine which method is the most accurate and could therefore be used to optimise the monitoring of patients, as well as to modify the currently used methods of treatment.
Material and methods
Study design
The study enrolled 37 patients with CD, hospitalised in the Department of Gastroenterology of the Self-Dependent Health Care Unit of Ministry of Interior in Gdansk in 2015–2017 to assess CD activity based on CDAI, blood biomarkers (haemoglobin, thrombocytes, iron, C-reactive protein (CRP)), faecal biomarker (calprotectin), and imaging techniques (ileocolonoscopy and magnetic resonance enterography).
Tests were conducted at a 1-week interval between imaging examinations, and other laboratory analyses were performed at a single stage, 24 h before colonoscopy.
The CDAI calculator takes into consideration: sex, weight, height, age, haematocrit, presence of abdominal masses, extra-intestinal complications, anti-diarrhoea drug use, number of soft/liquid stools, severity of abdominal pain, and patient’s general well-being.
CD may be active or inactive. The cut-off values were set at CDAI score ≤ 150.0 for the inactive disease and at CDAI score > 150.0 for the active disease.
An immunoturbidimetric method was used to assay serum CRP, which is a test for quantitative determination with high sensitivity, using antibodies coated on latex, against this human acute phase protein [24]. The cut-off value of 5.0 mg/dl was set to differentiate between the active disease (above the cut-off level) and inactive disease (below the cut-off level).
Faecal calprotectin was measured using the Quantum Blue calprotectin test for the quantitative measurement of calprotectin level in faecal samples.
Stool samples were stored in a refrigerator at 2.0–8.0°C and examined within 24 h, similarly to specimen tubes. Stool samples and specimen tubes were stored at room temperature (24.0 ±4.0°C) for 20.0 min before the procedure. Next, each stool sample was disrupted and dissolved in an extraction buffer. An automatic pipette was used to collect a faecal specimen, which was then inserted into a separate specimen tube and dissolved in the “chase buffer” in a 1 : 15 ratio (20.0 µl of the specimen + 280.0 µl of the buffer). The reader was calibrated to an extended range (30.0–1800.0 µg/g), and a faecal extract of 60.0 µl was loaded onto the loading port of the test cassette. After 12.0 min of incubation, the extract was put on a tray. The test cassette was automatically read, and the result was displayed on a screen. The cut-off value was set at 100.0 µg/g for disease activity.
In ileocolonoscopy, a SES-CD score was used to assess the disease activity. Five bowel segments were examined, and the following criteria were used to assess the severity of the disease.
Adding the scores from all five segments assessed the disease activity. The final score was interpreted in the following manner: ≤ 2.0: inactive CD; 3.0–6.0: mild CD; 7.0–15.0: moderate CD; > 16.0: severe CD.
For the purposes of this study, a score ≤ 2.0 points was considered indicative of an inactive inflammation process. Scores above 2.0 points, on the other hand, were indicative of an active inflammation process.
In MRE, the disease activity was assessed as active or inactive (by assessing the location of changes and the severity of the inflammation process) in the small and large intestine, based on the following examination protocol. Before the examination, a patient is asked to drink approx. 1.5 l of 3.0% mannitol solution over 60 min. During the examination, a contrast agent is administered (ProHance or Gadovist), and the following sequences are analysed according to the protocol:
T2 haste cor slice 3.5 mm gap 0 mm, TR 1200 ms TE 100 ms, matrix 288 × 384.
T2 haste stir cor slice 4 mm gap 0 mm, TR 1200 ms TE 100 ms, TI 180 ms, matrix 288 × 384.
T2 trufi cor slice 4 mm gap 0 mm, TR 3.51 ms TE 1.45 ms, matrix 167 × 256.
DWI cor slice 5 mm gap 0 mm, TR 6400 ms TE 65 ms, matrix 160 × 160, b = 0.50, 500, 800.
T2 haste tra slice 4 mm gap 0 mm, TR 1200 ms TE 102 ms, matrix 260 × 320.
T1 flash tra slice 4 mm gap 0.8 mm, TR 189 mm TE 4.93 ms, matrix 203 × 320.
T1 vibe fs cor dynamika CM slice 3 mm gap 0.6 mm, TR 4.36 ms TE 1.92 ms, matrix 183 × 288, dynamic – 8.
T1 flash fs tra slice 4 mm gap 0.8 mm, TR 145 ms TE 2.38 ms, matrix 167 × 256.
Statistical analysis
All data were compared by means of statistical analysis to determine the correlation between them and, at the same time, to identify the usefulness of particular markers of disease activity with reference to their sensitivity, specificity, and reliability, which has an impact on retesting and economic aspects of different tests.
The main assumption of the analysis was that methods used to detect CD activity (CDAI, endoscopy, enterography, and calprotectin) do not give false positive results. Moreover, none of these methods was considered a reference method. The true positive conditions were defined when either of the methods yielded a positive result. In other words, true negative conditions were specified when an investigation by all three methods brought a negative result. This implied that specificity and PPV (positive predictive value) were equal to 100.0%. Therefore, the comparison of methods presented in the article was based on sensitivity, negative predictive value (NPV), and accuracy. The authors also decided to measure the agreement between all methods based on the Cohen’s κ coefficient and compare them to the CDAI-based method.
Additionally, an optimal cut-off value was set for calprotectin, based on the ROC curve, with the use of two techniques: the tangent method and Youden index. Finally, all comparative analyses were performed separately for the small and large intestine, when possible.
The level of significance was set at α = 0.05, and all statistical analyses were performed using Statistica version 12.5.
The analysis was based on the following assumptions:
There is no gold standard when it comes to detecting disease activity in the small and large intestine.
Methods based on endoscopy and enterography have a positive predictive value (PPV = 100.0%), which means that if a patient is diagnosed with an active disease, the diagnosis is 100.0% certain – there are no false positive results (specificity = 100.0%).
A variable was defined as “reality”, which showed whether the disease was active, i.e. whether any of the two imaging techniques (endoscopy or enterography) revealed the activity of the disease.
It was assumed that:
Results
Approach no. 1
When the disease activity is assessed without dividing the intestine into segments – i.e. in the small and large intestine as a whole – it means that the disease is considered active if it occurs in any of the two bowel segments (Tables I– V).
Table I
Endoscopy
| Observed frequency – ileocolonoscopy | Reality | |
|---|---|---|
| Active | Inactive | |
| Active | 31 | 0 |
| Inactive | 2 | 4 |
| Total | 33 | 4 |
Table II
Magnetic resonance imaging
| Observed frequency – MR enterography | Reality | |
|---|---|---|
| Active | Inactive | |
| Active | 17 | 0 |
| Inactive | 16 | 4 |
| Total | 33 | 4 |
Table III
Calprotectin
| Observed frequency – faecal calprotectin | Reality | |
|---|---|---|
| Active | Inactive | |
| Active | 24 | 1 |
| Inactive | 9 | 3 |
| Total | 33 | 4 |
Approach no. 2
If we treat the assessment of disease activity separately, i.e. we analyse these exponents separately for changes in the small intestine and separately for changes in the large intestine, the statistical evaluation of the diagnostic methods used will be as follows:
Small intestine
Table VI
Endoscopy
| Observed frequency – endoscopy (small intestine) | Reality | |
|---|---|---|
| Active | Inactive | |
| Active | 12 | 0 |
| Inactive | 9 | 16 |
| Total | 21 | 16 |
Agreement of methods
The agreement of methods was assessed using an unadjusted coefficient of agreement and the Cohen’s κ coefficient (Table XII).
Table XII
Agreement of methods
A statistically significant agreement of methods was identified in the case of endoscopy and calprotectin, as well as CRP values and CDAI values.
There was a correlation between CRP and calprotectin, CRP and enterography of the small intestine, and CRP and colonoscopy of the large intestine.
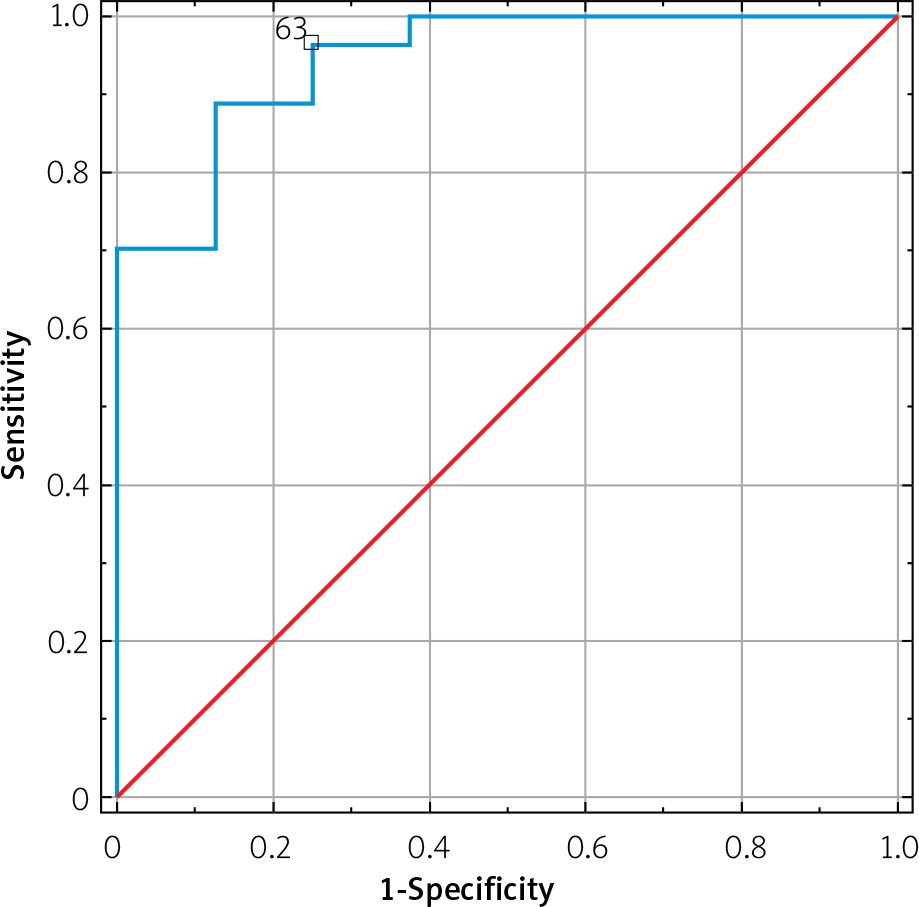
ROC curve for calprotectin
Calprotectin shows a high degree of effectiveness in the detection of CD activity in the large intestine and the bowel in general. However, the level of this biomarker should not be used for assessment of the disease activity solely within the small intestine.
According to the Youden Index, the cut-off value of 100.0 µg/g (sensitivity = 88.9%, specificity = 87.5%) and 43.0 µg/g (sensitivity = 93.8%, specificity = 75.0%) should be used for the large intestine and a full-scope detection, respectively (Figure 1).
Discussion
Recently, clinical management of patients with IBD has evolved, with the main aim now being not only clinical remission, but also mucosal healing.
Therefore, it is necessary to monitor the disease activity in order to detect it at its early subclinical stage, as well as taking the cost into account.
In this study, the following testing methods were assessed: clinical evaluation of CDAI disease activity, biomarkers: faecal calprotectin and serum CRP, imaging examinations: ileocolonoscopy, MR enterography.
Diagnostic tests were assessed in terms of their sensitivity and specificity, and in addition they were also compared to each other in order to specify which test is the most effective in quantitating CD activity, taking into consideration the fact that 20.0% of patients experience early relapses.
In our study, the sensitivity of the CDAI system (with a cut-off value of 150.0 points) was 76.5%, whereas the specificity was a mere 25.0%. The predictive positive value (PPV) was 89.7%, and the predictive negative value (PNV) was 11.1%. The accuracy of this method (ACC), which reflects the correct diagnosis of a patient regardless of the findings, was 71.1%. This can be set in comparison to a study in which CDAI was set against mucosal healing, defined as the lack of ulceration, and where the cut-off value for the disease activity was 150.0 points – PPV amounted to 65.0% and NPV to 53.0%.
In our study, the cut-off value for the process of inflammation was set at the CRP level of 5.0 mg/dl. It was demonstrated that when assessing this parameter in patients with changes limited to the small intestine, the sensitivity and specificity amounted to 66.7% and 68.8%, respectively. PPV and NPV were at the level of 73.3% and 67.6%, respectively, whereas the accuracy was estimated at 67.6%. In the case of changes within the large intestine, the sensitivity and specificity of this method was estimated at 64.3% and 88.0%, respectively, with PPV and NPV amounting to 94.7% and 44.4%, respectively. The accuracy of the method was 70.3%. Without differentiating the range of inflammatory changes, the sensitivity of the method was calculated at 58.8% with 100.0% specificity, whereas PPV and NPV stood at 100.0% and 22.2%, respectively. In this case, the accuracy was estimated at 33.2%.
In a study by Solem et al. [6] it was shown that CRP < 5.0 mg/dl with a normal endoscopic appearance of the intestinal mucosa was found in 75.0% of cases, and the elevated CPR level correlated with inflammatory changes. However, another study [25] showed that isolated changes in the ileum corresponded with high CPR values. Mosli et al. [10] conducted a meta-analysis of 19 studies (n = 2499 patients with IBD), in which the CRP level was compared with the endoscopic appearance of the mucosa. The sensitivity and specificity of this parameter were calculated at 49% and 92%, respectively, and it was suggested that CPR > 5.0 mg/dl may indicate endoscopic inflammatory activity.
Another biomarker, FC, is proportional to the migration of neutrophils to the digestive tract during an ongoing process of inflammation [4, 5, 25, 26].
In our study, the sensitivity and specificity of faecal calprotectin was calculated at 71.9% and 75.0%, with PPV and NPV of 95.8% and 25.0%, respectively. The accuracy (ACC) of this method was estimated at 72.2%.
The cut-off value of calprotectin was also determined, depending on the disease activity, which was 43.0 µg/g for the small intestine and 100.0 µg/g for the large intestine (p < 0.0001). The area under the curve (ROC AUC) was 0.87 without differentiating the range of changes and 0.944 for the FC value of 100.0 µg/g in the case of the large intestine.
The above values correlated with remission in the endoscopic image, as in the studies by Mosli et al. [10], D’Haens et al. [27, 28], and Roseth et al. [29] showing that the FC level < 50.0 µg/g correlates with a full remission on ileocolonoscopy. The analysis we conducted also showed a difference in the FC value for the activity of the inflammatory process in the small intestine and large intestine, with simultaneous correlation of the endoscopic image with the value of this biomarker.
Other biochemical parameters, such as complete blood count (haemoglobin, platelets) and iron level, did not correlate with the disease activity, and therefore were not included in the analysis.
In imaging examinations, the usefulness of such techniques as ileocolonoscopy or MR enterography was analysed.
The most sensitive and specific method of assessing the activity of inflammation is ileocolonoscopy. Its limitation, however, is the scope of the examination because it only reaches the distal segment of the ileum.
In our study, SES-CD was used to assess the inflammation activity during ileocolonoscopy, with cut-off value < 2.0 points as an indicator of disease inactivity and > 2.0 points as an indicator of disease activity. The sensitivity of this method was calculated at 93.6%, whereas the specificity was 100.0%. PPV and NPV were 100.0% and 66.7%, respectively. The accuracy was estimated at 94.6%. Thus, colonoscopy remains the gold standard when diagnosing IBD [30].
When assessing the disease activity using a different imaging technique, i.e. MR enterography, the sensitivity of this diagnostic tool was 51.5%, whereas the specificity was 100.0%. PPV and NPV were 100.0% and 20.0%, respectively. The accuracy stood at 56.8%.
The sensitivity and specificity of MRE were slightly better for the small intestine: the values were 66.7% and 100.0%, respectively, with PPV and NPV of 100.0% and 69.6%. The accuracy was 81.1%. For the large intestine, on the other hand, the sensitivity and specificity were significantly lower: 33.3% and 100.0%, respectively, with PPV and NPV of 100.0% and 33.3%. The accuracy of this method for the large intestine was calculated at 50.0%.
Generally, it is thought that MRE, used as a tool for assessing CD activity, shows an average sensitivity and high specificity within the large intestine [31]. It seems that MRE is a more sensitive diagnostic tool when detecting complications of the disease, such as fistulae or stenoses [27].
All of the diagnostic tools analysed above were also compared to each other, using a non-adjusted coefficient of agreement and Cohen’s κ coefficient. The comparison showed a strong correlation between an endoscopic examination – colonoscopy – and faecal calprotectin. This once again emphasises that applying faecal calprotectin as a biomarker is an effective method of monitoring the inflammation process and may be used to optimise the therapeutic process.
Conclusions
By analysing the diagnostic methods used to assess disease activity within the small intestine (the distal segment of the ileum) and the large intestine, it was found that endoscopy is the most accurate diagnostic tool, followed by faecal calprotectin. The least sensitive methods include: MR enterography and CDAI. A statistically significant agreement between endoscopy and faecal calprotectin was demonstrated. The cut-off value of FC (taking into account both the small intestine and the large intestine), in correlation with endoscopic findings indicative of the disease activity, was 43.0 µg/g. The cut-off value of FC, in correlation with endoscopic findings indicative of the disease activity, was 100.0 µg/g for the large intestine. CRP shows statistical significance with CDAI, and it correlated with the endoscopic appearance of the large intestine, MRE of the small intestine, and the faecal calprotectin level. By assessing the inflammation activity for the small and large intestine separately, it was found that MRE is a slightly better diagnostic tool in the case of the small intestine, whereas ileocolonoscopy is a preferred method for examining the large intestine.