

Introduction
According to the World Health Organization (WHO), between 1.8 and 2.7 million people worldwide are poisoned by snake bites, with an estimated 5.4 million bites occurring annually. Shockingly, between 81 410 and 137 880 people die annually from snake bites, and three times more people undergo amputations due to the envenomation [1]. In Europe, all poisonous snakes belong to the genus Vipera, and the annual incidence of their bites is relatively low, 1/100 000 inhabitants. However, approximately 1000 severe envenomation cases, which can lead to disability, occur annually in Europe, including European Russia and Turkey [2]. Therefore, it is crucial to have antivenom, which is the only specific therapy available to treat those who have been bitten by venomous snakes.
Antivenoms are composed of polyclonal antibodies purified from sera of large animals, usually horses, which effectively neutralize the venoms [3]. The effectiveness of the antivenom is determined by the potency test, the gold standard, that measures the neutralization of venom-induced lethality in mice [4]. This test is mandatory for antivenom release but needs improvement.
Snake venoms are mixtures of toxic and non-toxic proteins that differ between species. Elapidae venoms are neurotoxic, while Viperidae venoms are hemotoxic. However, it is not all so simple, because in Viperidae venoms there exist proteins that have neurotoxic effects, and vice versa. V. ammodytes venom has 139 protein components, with only 38 being toxic [5]. The venom proteins include snake C-type lectin-like proteins, serine proteases, metalloproteinases, phospholipases A2 (PLA2), and L-amino acid oxidase (LAAO) [6].
Antivenom tests use mice, which are more sensitive to neurotoxic components, while humans are more sensitive to hemotoxic components [7]. Researchers are replacing animal tests with in vitro methods due to growing awareness and concern for animal welfare.
Cell-based assays are in vitro tests that resemble toxicity tests on laboratory animals, but have limitations. They are highly dependent on culture conditions, and interpreting the results requires careful consideration of cell viability, cytotoxicity mechanisms, and relevance to in vivo toxicity [8]. Despite this, they are valuable tools for studying venom cytotoxicity, providing detailed insights into venom-induced cellular damage [9]. They reduce animal use and are cost-effective, reproducible, and customizable to assess specific endpoints. Regulatory bodies accept them as valid alternatives for assessing toxicity and safety profiles [10, 11].
With this in mind, we examined and compared well-known and easily applicable cell-based methods to consider replacing the potency test. We used Viper ammodytes venom and the corresponding antivenom Viekvin on the Vero cell line for a specific purpose. We used various methods for measuring cytotoxicity, each based on different biological mechanisms. To determine cell viability, we used the 3-(4,5-dimethylthiazol-2-yl)-2,5-diphenyltetrazolium bromide (MTT), crystal violet (CV), trypan blue (TB), and propidium iodide (PI) assays.
MTT assay determines cell viability based on cell metabolic activity, of both mitochondrial and cytosolic enzymes, such as NADH reductase and flavin oxidases [12, 13]. Since we previously found that the signal obtained in the MTT assay may be due to the activity of venom LAAO also [14], we defined the preparation of the cells for the MTT assay to detect only the activity of living cells.
The principle of the CV [15] staining method is that the living cells adhering to the plastic surface can be stained with CV dye that binds to proteins and DNA, and the signal is measured spectrophotometrically. Dead cells are washed away during staining.
Propidium iodide and TB are methods that measure cell viability based on cell membrane integrity, and both dyes pass only through the membrane of dead cells. Propidium iodide binds to double-stranded DNA by intercalating between base pairs, and the detection of stained cells is performed by flow cytometry. Trypan blue stains intracellular proteins [16]. In contrast to other tested methods that determine the percentage of viable, and thus also the percentage of dead cells, the usage of trypan blue dye allows the determination of the absolute number of cells per unit volume.
In addition to directly causing cell death, venom enzymes also do so indirectly, by inducing apoptosis (via ROS). By using annexin V and acridine orange/ethidium bromide (AO/EB) staining, we examined the proapoptotic ability of V. ammodytes venom and the antiapoptotic potential of the antivenom.
Survival of cells treated with venom or venom/anti-venom mixtures was measured by the above methods, and the benefits of each were assessed.
Material and methods
Chemicals and reagents
All chemicals and reagents were purchased from Sigma (Germany) unless otherwise stated. FITC annexin V Apoptosis Detection Kit I (cat. no. 556547) was purchased from BD Pharmingen (USA).
Venom and antivenom
The snake antivenom Viekvin is a registered product of the Institute of Virology, Vaccines and Sera “Torlak” that ensures safe and effective treatment of European snake envenomation. The antivenom Viekvin is prepared for intramuscular [17] or, in cases of severe poisoning, intravenous administration [18]. The manufacturing process of the snake antivenom Viekvin is well established and consists of several steps: 1) the immunization of horses with freeze-dried venom (the venom was collected by milking V. ammodytes adult snakes from the geographical area of Serbia) to obtain hyperimmune plasma as a source of venom-specific equine immunoglobulins [19]; 2) pepsin digestion and the fractionation by ammonium sulfate to obtain fragments F(ab'2) [20]; 3) preparation of the final product according to the snake antivenom Viekvin specification: 1 ml neutralizes at least: 100 × LD50 (median lethal dose) of V. ammodytes venom and 50 × LD50 of V. berus venom.
To determine the effectiveness of antivenom, the LD50 and ED50 are calculated using the Spearman-Kärber statistical test. LD50 is the amount of venom that causes death in half of the mice, while ED50 is the antivenom dilution that, when mixed with N times the LD50 value of venom, causes death in half of the mice. The antivenom potency (P) is calculated according to European Pharmacopoeia 11.0 as the number of LD50s neutralized by one milliliter of antivenom.
Since we have presented in vitro experiments, the results are presented as the effective concentration (EC50) of antivenom required to neutralize a microgram of venom, AU/µg.
Vero cell preparation
The Vero cell line was obtained from ATCC cell bank (number #CRL-1587) and was routinely grown in complete RPMI 1640 medium supplemented with complement depleted (56°C, 30 min) 10% (v/v) fetal calf serum (FCS), 100 UI/ml penicillin and 100 µg/ml streptomycin. The cells were incubated in a humid chamber of 5% CO2 at 37°C and were used or subcultured when reaching an 80-90% confluent monolayer.
The Vero cell suspension for cytotoxicity measurement was prepared following the standard protocol [21] with 0.05% trypsin/0.02% EDTA. Cells were counted with trypan blue in a hemocytometer and adjusted in PBS to 0.5 × 10⁶/ml.
Incubation of Vero cells with venom or venom/antivenom mixture
A series of double dilutions of the venom was prepared so that, after the addition to the 0.5 ml of cell suspension (250 000 cells/tube), the final concentrations ranged from 1000 µg/ml to 0.5 µg/ml.
To be able to compare methods for cytotoxicity under the same conditions, mixtures were prepared such that the final concentrations in the cell suspension of the anti-venom were in the range of 8 × 10⁻⁴ AU/ml – 6.5 AU/ml and the final concentration of venom was one IC50. Before addition to cells, the mixtures of venom/antivenom were incubated for 30 min at 37°C. After 1.5 h at 37°C, 5% CO2, the suspensions were washed three times with 0.5 ml of PBS and centrifuged at 300 g for 5 min at room temperature (RT). For PI, AO/EB, and TB staining pellets were resuspended in 0.5 ml of PBS; for annexin V staining in 0.5 ml of annexin V binding buffer, and for the remaining tests (CV, MTT) the cells were resuspended in 0.5 ml of medium. The cells stained with PI, AO/EB, annexin V, and TB were analyzed immediately. Crystal violet and MTT tests were done on 96-well plates. One hundred microliters of cell suspension per well was seeded, plates were centrifugated for 5 min at 300 g and staining was performed 48 h later.
Calculation of venom IC50 and antivenom EC50
The percentage of cellular viability after incubation with V. ammodytes venom was calculated proportionally to the untreated sample. Based on the obtained results, we determined 50% of the cytotoxic effect (IC50) of the venom for each method, with exponential regression.
The anti-cytotoxic potency of the snake antivenom Viekvin is described using the effective concentration of antivenom that neutralizes 50% of the cytotoxic effect (EC50). To test each individual method, first, the IC50 was determined, and then twice the concentration was used to mix with a series of twofold dilutions of the antivenom. The EC50 was calculated using a regression dose-dependent sigmoidal curve, represented by Hill’s equation, and is given as the number of antitoxic units per microgram of venom (AU/µg).
In the equation, Y is the response, percentage of viable cells; X is antivenom concentration; T is the top asymptote, B is the bottom asymptote; logEC50 is the X value when the response is halfway between the bottom and top; n is Hill’s coefficient, which represents the slope of the linear part of the curve. All calculations were done with appropriate statistical tools in the OriginLab program.
MTT assay
The MTT method was established by Mosmann [12]. Aliquots of the Vero cell suspensions were incubated with venom or venom/antivenom mixture, washed thoroughly by centrifugation (3 × 800 g, 5 min), and then placed in microtiter plate wells. The cells were incubated in a humid chamber with 5% CO2 at 37°C for 48 h. After removal of the medium, 100 µl/well of 0.5 mg/ml MTT/RPMI without phenol red was added to each well and incubated for 2 h at 37°C. Insoluble formazan crystals were dissolved by the addition of 10% SDS w/v/10 mM HCl (100 µl/well). After overnight incubation at 37°C, absorbances were measured at 580 nm in a microplate reader. All samples were tested in triplicate and the results are expressed as the mean value.
Crystal violet staining
After incubation with venom or venom/antivenom mixture, cell suspensions were washed with PBS and incubated in a microplate, in a humid chamber of 5% CO2 at 37°C for 48 h. The cells were washed again twice with PBS and then stained with crystal violet as usual [15].
Trypan blue staining
Cells were taken after incubation with the venom or venom/antivenom mixture, washed, mixed with trypan blue staining solution (0.4% w/v in PBS), and immediately counted in a hematocytometer [16]. Cell viability was determined proportionally to untreated cells, which were considered 100% viable.
Propidium iodide staining and flow cytometry analysis
The staining solution of propidium iodide (50 µg/ml/PBS) was added to the washed cell suspension (v : v = 1 : 500) and incubated for 5 min at RT. Analysis was conducted by flow cytometry (FACSVerse; Beckton Dickinson).
Annexin V staining
For staining apoptotic cells, the FITC/annexin V BD Pharmingen kit was used in kit No. 556547.
AO/EB staining
The dye mix (100 µg/ml AO and 100 µg/ml EB in PBS) was added to the cell suspension after incubation with venom and washing (v : v = 1 : 100). The cells were visualized under a fluorescence microscope (Olympus, BH-2), using a blue filter at 10× and 100× magnification [22].
Results
MTT assay
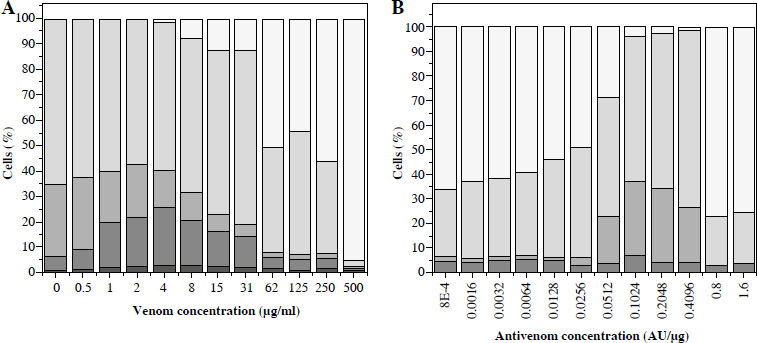
The MTT assay showed that even nanogram quantities of venom affect cell viability. An increase in venom concentration leads to an exponential increase in cell death in suspension (Fig. 1A).
Fig. 1
MTT activity of Vero cells after incubation with different quantities of V. ammodytes venom (A) and mixtures of one IC50 venom (determined by MTT assay) and different two-fold dilutions of V. ammodytes antivenom (B). Dashed lines represent the regression curve
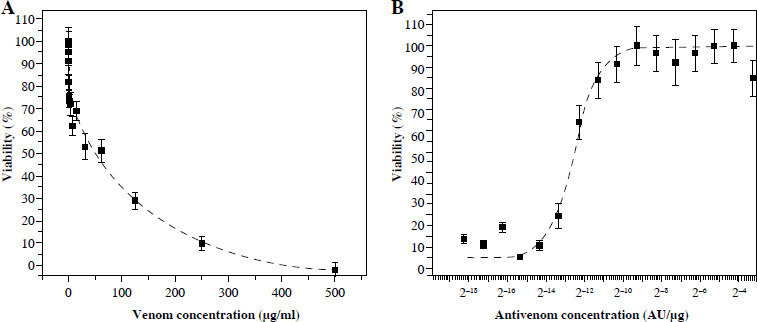
With antivenom less than (1.6 ±0.1) × 10–5 AU/µg, the cytotoxic activity of one IC50 venom (62.5 µg/ml) cannot be neutralized (Fig. 1B). Venom neutralization begins with an increase in concentration, and complete neutralization is achieved with 0.1 AU/µg. The obtained MTT result showed that the antivenom completely neutralized the components of the venom that induce cell death. Measured by this method, the effective concentration (EC50) was (1.6 ±0.1) × 10–5 AU/µg (Table 1).
Table 1
IC50 of venom and EC50 of antivenom
[i] B – bottom asymptote, represents ECmin (AU/µg), T – top asymptote, represents ECmax (AU/µg), logEC50 is the X value when the response is halfway between the bottom and top, n – Hill’s coefficient, which represents the slope of the linear part of the curve, R2 – coefficient of determination, MTT – 3-(4,5-dimethylthiazol-2-yl)-2,5-diphenyltetrazolium bromide, CV – crystal violet, TB – trypan blue, PI – propidium iodide
Crystal violet staining
Crystal violet staining showed that venom concentrations ≥ 0.5 µg/ml had detectable cytotoxic effects on Vero cells (Fig. 2A). Cell death was exponentially dependent on venom concentration. Measured by this method, the IC50 of venom is 55 mg/ml.
Fig. 2
CV staining of Vero cells after incubation with different quantities of V. ammodytes venom (A) and mixtures of one IC50 venom (determined by crystal violet staining) and different two-fold dilutions of V. ammodytes antivenom (B). Dashed lines represent the regression curve
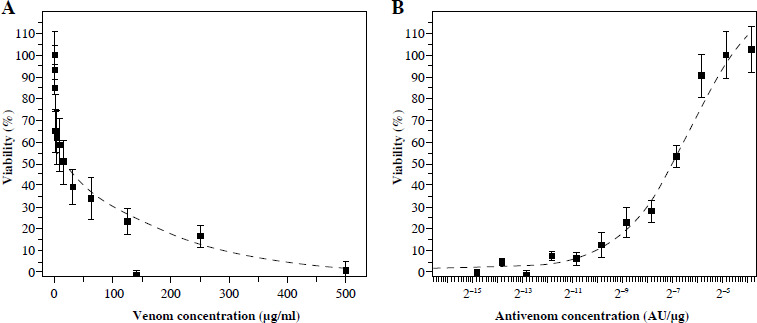
An increase in the concentration of antivenom preincubated with a constant amount of venom (55 µg/ml) indicates the same curve shape as measured by MTT (Fig. 1B and 2B). The CV method detected that EC50 was (54.0 ±10.0) × 10–5 AU/µg (Table 1).
Trypan blue staining
An increase of dead cells started from a venom concentration of ~ 0.5 µg/ml. At venom concentrations greater than 4 µg/ml, cell degradation started as well as further reduction of living cells (Fig. 3A). Venom IC50 determined by this method was 66 µg/ml. Further increase of concentration caused intense degradation of both dead and living cells, and thus a reduction in total cell number.
Fig. 3
Vero cell viability counted in a hematocytometer after trypan blue staining. Cells incubated with different venom concentrations (A) and mixtures of one IC50 venom (determined by trypan blue staining) and different two-fold dilutions of V. ammodytes antivenom (B). White part of column – disintegrated cells; black part of column – dead cells; grey part of column – viable cells
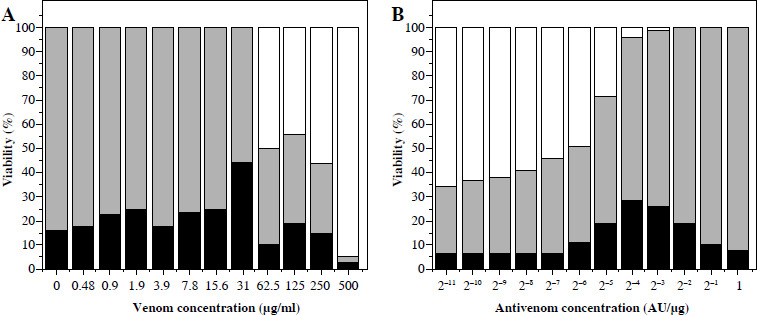
Concentrations of antivenom of 75 × 10–5 AU/µg and higher increased the number of living cells, and reduced cell degradation caused by 66 µg/ml venom concentration (Fig. 3B). The TB method also confirmed that the snake antivenom Viekvin has significant anticytotoxic potential and that the EC50 is (600.0 ±200.0) × 10–5 AU/µg (Table 1).
Propidium iodide staining and flow cytometry analysis
Flow cytometry analysis of Vero cells in suspension after incubation with venom shows that the increase of venom concentration increases the presence of dead cells (PI+) (Fig. 4A). The IC50 of venom is 87 µg/ml as measured by this method. At venom concentrations greater than 250 µg/ml no living cells can be detected. The effects of less than 32 µg/ml of venom on Vero cells are not detected by PI staining.
Fig. 4
Percentage of PI+ Vero cells in suspension determined by flow cytometry (A and B) and time required for FACSVerse to count 10 000 cells (C and D) after incubation with venom (A and C) and mixtures of one IC50 venom (B and D, determined by propidium iodide staining and flow cytometry analysis) and different two-fold dilutions of V. ammodytes antivenom. Dashed lines represent the regression curve
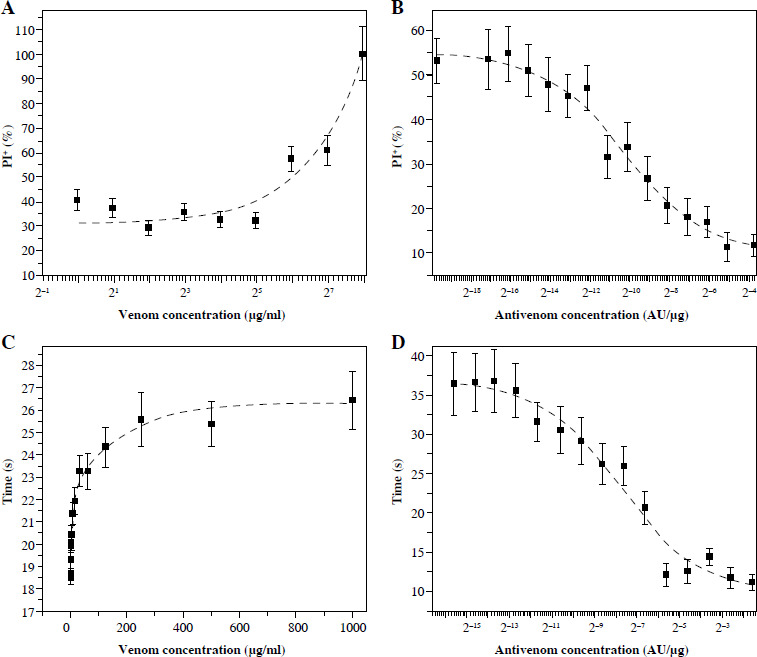
As the flow cytometry experiment was set to count 10 000 events (cells) and the flow was constant, the time required to reach this cell number can be informative. The time required to analyze one sample was gradually increased with increasing venom concentration (Fig. 4C). This parameter detects the effects of lower venom concentrations and lower IC50 (20 µg/ml) than can be detected by the PI+ cell percentage. For concentrations higher than 250 µg/ml time analysis also detects the absence of living cells.
Incubation of a constant amount of venom (IC50) with increasing amounts of antivenom decreased the concentration of free venom, so the percentage of dead cells decreased, as well as the time required to count 10 000 events (Fig. 4B, D, respectively). The EC50 of the antivenom determined according to the percentage of dead cells was (9.2 ±2.3) × 10–5 AU/µg, and the EC50 determined according to the time required was (30.0 ±10.0) × 10–5 AU/µg (Table 1).
FITC annexin V/PI
We analyzed whether V. ammodytes venom induces apoptosis in Vero cells and whether it is inhibited by the snake antivenom Viekvin. Vero cells were treated with venom or venom/antivenom and analyzed with flow cytometry after staining with FITC annexin V/PI (Fig. 5).
Fig. 5
Percentage of annexin V/PI Vero cells determined by flow cytometry in suspension after incubation with different quantities of V. ammodytes venom (A) and mixtures of one IC50 venom (determined by MTT method) and different two-fold dilutions of V. ammodytes antivenom (B). White part of column – disintegrated cells; light gray part of column – viable cells (annexin V–/PI–); middle gray part of column – cells in early apoptosis (annexin V+/PI–); dark gray part of column – cells in late apoptosis or necrosis (Annexin V+/PI+); black part of column – necrotic cells (Annexin V–/PI+)
The percentage of cells that were degraded was considered during the processing of the results. At venom concentrations of 0-4 µg/ml the presence of early (annexin V+/PI–) and late apoptotic (annexin V+/PI+) cells increases, but at higher concentrations, all cells – viable (annexin V–/PI–), apoptotic, and dead (annexin V–/PI+) – disintegrate. As the cell membrane in early apoptosis is intact, early apoptotic cells were detected as viable by previous methods. In order to make the methods comparable, cells in early apoptosis were also considered viable when calculating IC50 after annexin V/PI staining. With this method, it was found that the IC50 of the venom is 62 µg/ml.
Antivenom prevents cell degradation induced by the amount of 62.5 µg/ml and increases the presence of viable and apoptotic cells already from 0.5 AU/ml and the ED50 of the antivenom is 0.087 AU/µg (Fig. 5).
AO/EB staining
The presence of apoptotic, living, and dead cells in suspensions treated with venom or venom/antivenom mixture was confirmed by staining with AO/EB. This staining confirms the conclusions obtained by the previous methods: the presence of living cells in suspension decreased and the percentage of dead or disintegrated cells increased due to increased venom concentrations. Increasing the amount of antivenom increases the number of living cells due to neutralization of free venom.
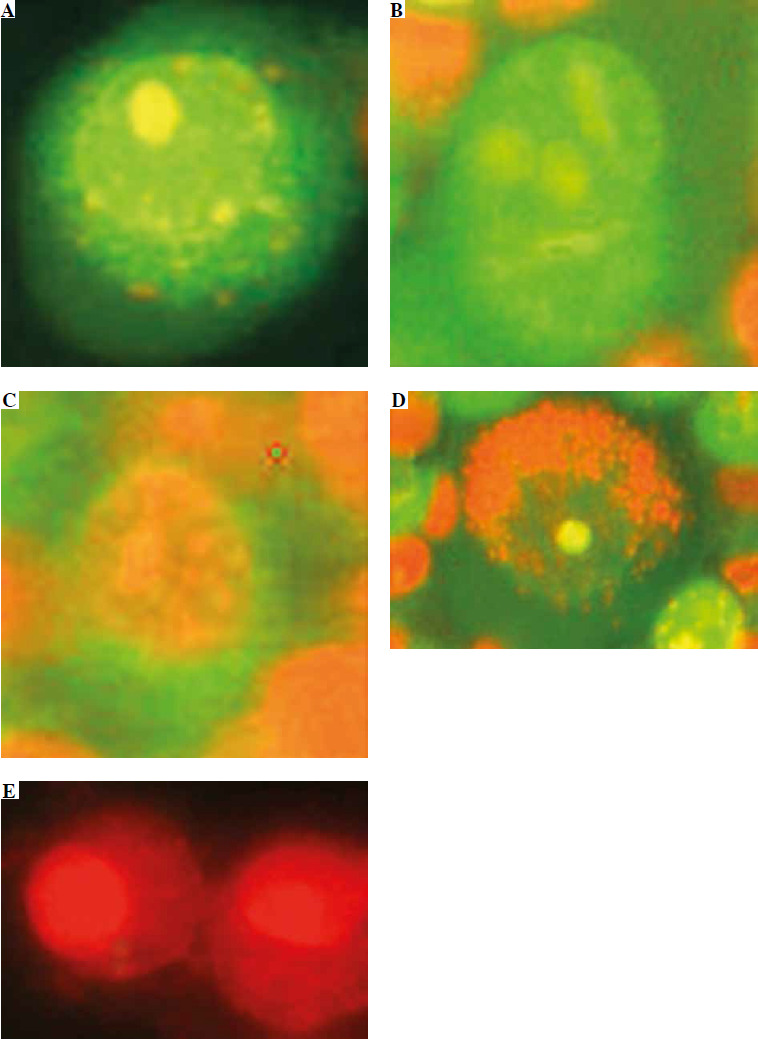
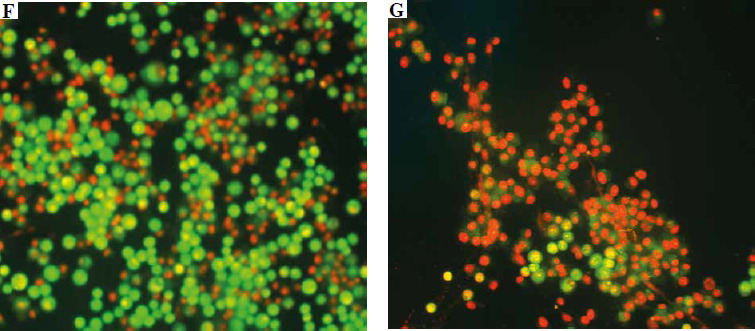
In addition to detecting live (green nucleus and cytoplasm, Fig. 6A, F), early and late apoptotic (Fig. 6B, C), and dead cells (red nucleus and cytoplasm, Fig. 6E, G) by AO/EB staining, we also observed cells with green nucleus and red cytoplasm (Fig. 6D). Cells are stained in this way because venom enzymes disrupt the integrity of the cell membrane but not the nuclear membrane. This allows both colors to enter the cytoplasm, which then turns red, while only AO passes through the intact membrane of the nucleus and turns it green. We considered these cells to be early necrotic because there was no characteristic apoptotic condensation of nucleus chromatin.
Fig. 6
Vero cells stained with AO/EB, observed under a fluorescent microscope. The scale bar in photos A-E indicates 20 μm: A) viable cell, B) early apoptotic cell, C) late apoptotic cell, D) early necrotic cell, E) necrotic cell. The scale bar in photos F and G indicates 500 μm: F) cell suspension without venom, G) cell suspension with venom
Discussion
In this study, we considered the suitability of different methods for evaluating the cytotoxicity of V. ammodytes venom, as well as for determining the anticytotoxic potency of the corresponding antivenom Viekvin. The methods chosen are based on different principles of detecting living or dead cells, and these were CV, TB, and PI staining and MTT assay. Additionally, we measured the venom-induced apoptosis, using annexin V/PI and AO/EB staining.
The Vero cell line is continuous and anchorage-dependent. We chose to incubate venom with those cells, but in suspension and only after that to measure cytotoxicity using the selected methods. Working with a suspension allows us to compare all methods under the same conditions and to thoroughly wash the cells from the venom. Washing is a very important step for two reasons: 1) residual venom would continue to damage the cells even after incubation, and 2) venom can give a false positive signal during incubation with MTT substrate [14]. We noticed that if the methods based on live cell detection (MTT and CV) are performed immediately after washing, only very weak signals are detected (data not shown). Live cells are present but not metabolically active enough, probably due to the treatment of cells with venom and/or with trypsin, which both cause stress on cells [23]. In addition, it is known that for Vero cells to achieve their normal physiological state, the presence of a biomechanical microenvironment is necessary [24]. Therefore, we allowed cells to recover for 48 h at 37°C in a growth medium, before performing tests. This procedure made it possible to initiate a cell attachment with protein-based cell receptors with surface area and to establish normal metabolism [25].
Both methods, MTT and CV, clearly show that increasing the amount of venom in the suspension proportionally reduces the presence of viable cells (Fig. 1A and 2A). The sensitivity of both methods is very high; the live cell signal decreases at nanogram quantities of venom.
Trypan blue staining is useful for distinguishing between living and dead cells and determining their absolute number. By comparison with the negative control, the number of disintegrated cells can be calculated as well (Fig. 3). Cell disintegration can lead to overestimation of the protective potency of antivenom due to overestimation of the percentage of living cells. When venom concentrations exceed 30 µg/ml, the number of dead cells drastically decreases due to cellular disintegration caused by venom enzymes [26]. The TB method can be used to determine the threshold concentration of venom after which cell degradation begins, which varies for each venom of different snake species [22]. In our model, the threshold concentration of venom was 4 µg/ml.
We analyzed the suitability of flow cytometry with PI+ cell counting, which is a dye exclusion method, and estimated dead cells in suspension. This method is less sensitive than the previous one because PI+ cells could not be detected at venom concentrations less than 32 µg/ml. We observed that the time required to load into the cytometer and analyze 10 000 cells per sample was directly proportional to the amount of venom (Fig. 5) and it was a more sensitive parameter than measuring the percentage of dead cells.
In our experimental model, there were no statistically significant differences (p < 0.05) among the means of the IC50 of V. ammodytes venom determined by all methods (MTT, CV, TB, and PI%) (Table 1).
The study also assessed the anticytotoxic potency of antivenom using the same methods. Cell viability curves revealed an S-shaped pattern, reflecting the reactivity of antibodies with venom components. The linear portion of the curves allowed EC50 values to be determined (Table 1), indicating the concentration of free venom not neutralized by antivenom. Although all methods showed effective neutralization of venom cytotoxicity of the selected amount (IC50), statistically significant differences were observed in EC50 values obtained by TB compared to EC50 obtained by MTT (**p = 0.0057), CV (*p = 0.0105), PI% (**p = 0.0062), and PI time (**p = 0.0079).
These differences may be attributed to variations in the immunogenicity of venom components [27], leading to differential neutralization by antibodies. Overall, the study underscores the importance of considering these factors when evaluating antivenom potency.
Snake venom, besides killing cells directly, also induces apoptosis [27-29]. To determine how V. ammodytes venom affects apoptosis, the Vero cell suspension was stained with annexin V/PI after incubation with venom (Fig. 6). It is evident that relatively low concentrations of venom cause an early phase of apoptosis. These cells were also detected in suspensions without venom, which is most likely due to the detachment of adherent cells from the substrate [30]. An increase in venom concentration induces an increase in the percentage of cells in early apoptosis (annexin V+PI– phenotype), probably due to ROS released by the action of venom components [31].
It was previously found [32] that annexin V+PI+ can be a phenotype of primary necrotic as well as late apoptosis cells. Because the appearance of annexin V+PI– cells is directly followed by the appearance of annexin V+PI+ phenotype cells (Fig. 5A), we concluded that these are cells in the phase of late apoptosis. After increasing the venom concentration to more than 4 µg/ml, the presence of early, late apoptotic, and viable cells decreased significantly due to the strong activity of venom enzymes directed towards cell membrane disintegration, and annexin V+PI+ cells were detected only sporadically (Fig. 5). At concentrations higher than 30 µg/ml, cell necrosis dominated. We used the AO/EB staining method to detect live, early and late apoptotic, dead and necrotic cells [33].
Conclusions
This study evaluated in vitro methods for assessing V. ammodytes venom cytotoxicity and determining Viekvin antivenom’s potency. Methods such as CV, TB, PI staining, and MTT assay proved effective in discerning the venom’s impact on cell viability.
The IC50 was consistent across all methods, but EC50 varied due to venom immunogenicity and antibody-neutralizing capacity.
Considering the diverse venom compositions and immunogenic profiles, the choice of method must be carefully tailored to ensure accurate evaluation of both venom cytotoxicity and antivenom potency, thereby contributing to improved therapeutic interventions for snakebite envenomation.