

 ENGLISH


Introduction
It is well known that children born small for gestational age (SGA) are predisposed to obesity, insulin resistance (IR), and lipid disorders, which can be observed as early as the first decade of life [1–3]. It is assumed that the cause of these disorders may be oxidative stress during pregnancy [4], epigenetic regulation in the foetal period [5], and both peripheral and central IR observed during the catch-up growth phenomenon [6, 7]. Many studies have shown that IR in children with SGA may also be associated with increased IGF-1 concentration [8], decreased activity of 11βHSD2 in the placenta, and consequently increased cortisol concentration [9]; it may also be related to leptin resistance, hypoadiponectinaemia, or higher resistin levels [10–13].
A commonly used index to assess insulin resistance (IRI) is the IRIHOMA [14]. However, this IR index, derived from fasting glucose and insulin, predominantly reflects hepatic rather than peripheral insulin sensitivity [15]. In some patients, high and prolonged postprandial insulin secretion is observed, despite normal fasting glucose and fasting insulin concentration [16]. The adequacy of postprandial insulin and glucose concentrations can easily be assessed during the oral glucose tolerance test (OGTT) by calculating IRI according to Belfiore (IRIBelfiore) [16], with modifications intended for the paediatric population [17]. It reflects the peripheral IR, associated with muscle and adipose tissue function. Early identification of metabolic disorders and their treatment are recommended in children with SGA, but it is uncertain whether the OGTT, with the assessment of IR, is substantively justified and whether it will prove to be a useful diagnostic tool for early identification of IR and the likelihood of developing further metabolic disorders.
The aim of this study was to compare the incidence of IR based on abnormal IRIHOMA and/or abnormal IRIBelfiore in normal-height prepubertal children aged 6-8 years (after catch-up growth phenomenon), who were born SGA. Additionally, we aimed to compare auxological parameters, lipids, IGF-1, cortisol, adipocytokines concentrations, and blood pressure in groups with normal and abnormal IRI evaluated according to the 2 aforementioned methods, to determine the usefulness of IRIBelfiore in the diagnosis of IR and in predicting future metabolic complications.
Material and methods
An approval for the study was obtained from the Bioethical Committee at the Polish Mother’s Memorial Hospital - Research Institute (PMMH-RI) in Lodz, Poland.
Using the database of PMMH-RI in Lodz, Poland, written invitations were sent to the parents of all children who were born in 3 consecutive years with a birth weight (BW) below 2500 g and who are currently aged 6–8 years.
A total of 143 children responded to the invitation. They underwent the same regimen of an outpatient visit, which included an analysis of data from the child’s health record book, measurement of the child’s height and weight, and a physical examination. Only full-term (GA – 38 weeks) children without severe birth defects or genetic syndromes were included in the study. Therefore, 12 premature infants, as well as one child with congenital defects were excluded from the study. There were no cases with Silver-Russell or Turner syndrome phenotype in the analysed group.
Based on birth data, the birth weight standard deviation score (BW SDS) was calculated for sex and gestational age (GA) [18]. The BW SDS of every child was below –2.0. Next, based on current height and weight, the following indices were determined: the height standard deviation score (HSDS), body mass index (BMI), and BMI standard deviation score (BMI SDS). All these parameters were calculated according to the local population data [19]. Only one child had an HSDS below -2.0, so he was also excluded from further analysis (it was the child with persistent short stature, i.e. without catch-up growth phenomenon).
Finally, 129 children (79 girls and 50 boys) born as SGA, aged 6–8 years (mean: 6.87 ±1.35 year), with currently normal height, were enrolled in the study group. All children were in the prepubertal period, defined as Tanner stage I [20]. Waist circumference was measured in each child, and the waist-to-height ratio (WHtR) was calculated, which is a good indicator for assessing the prevalence of visceral obesity in children [21]. Obesity was diagnosed when BMI was > +2.0 SD, and visceral obesity was diagnosed when the WHtR ratio exceeded 0.5 [21]. Next, systolic blood pressure (SBP) and diastolic blood pressure (DBP) were measured after 5 minutes of rest in the seated position. Percentile charts for age and sex were used for their analysis [22]. All children were fasting, having eaten their last meal 12 hours earlier. In each child, fasting triglyceride (TG) and lipids (total cholesterol, LDL-cholesterol, and HDL-cholesterol), cortisol, IGF-1, adiponectin, leptin, and resistin concentrations were assessed, and the oral glucose tolerance test (OGTT) was performed. During the OGTT, plasma glucose and insulin concentrations were measured in the fasting state, after 60 minutes, and after 120 minutes following oral glucose administration (1.75 g per kg of body weight, with 75 g being the maximum dose).
Glucose levels were considered abnormal if they exceeded 99 mg/dl in fasting state or 140 mg/dl at 120 minutes of OGTT.
IRIHOMA was calculated according to the following formula [14]: (fasting glucose [mmol/l] × fasting insulin [uIU/ml])/22.5). IRIHOMA >2.5 was considered to be IR [23, 24].
IRIBelfiore was calculated according to the following formula [16]: IRIBelfiore = 2/{[1/(INSAUC × GLUAUC)]+1}, where: INSAUC = INS AUCi/INSAUCmean and GLUAUC = GLUAUCi/GLUAUCmean. GLUAUCi and INSAUCi – area under glucose and insulin curves, respectively, during OGTT for a given patient; GLUAUCmean and INSAUCmean – area under glucose and insulin curves, respectively, during OGTT for a given group.
IRIBelfiore > 1.27 was considered to be IR [17]. We had obtained this value in an earlier study, in which we assessed the cut-off point for IRIBelfiore in healthy children with a sensitivity of 89.5% and specificity of 89.1% [17].
The control group consisted of 17 children matched for age, born with normal birth weight (appropriate for gestational age, AGA), who had normal body weight and height and did not present any endocrinological disorders. This group was used in our previous study [13].
Plasma glucose was determined by the enzymatic method using hexokinase.
Plasma insulin concentration was measured using the DRG ELISA kit with a sensitivity level of 1.76–100 µIU/ml. The intra-assay coefficient of variation (CV) ranged from 1.8% to 2.6%, and the inter-assay CV ranged from 2.9% to 6.0%.
IGF-1 was assessed by Immulite, DPC assays; WHO NIBSC 1st IRR 87/518 standard was applied, with the analytical sensitivity of 20 ng/ml, calibration range up to 1600 ng/ml, intra-assay CV – 3.1–4.3%, and inter-assay CV – 5.8–8.4%. For comparison of children with different age and sex, IGF-1 concentrations were expressed as IGF-1 SDS, according to reference data [25].
The leptin, adiponectin, and resistin concentrations were measured using the Millipore ELISA kit (Linco Research). Sensitivity level, the intra-assay CV and inter-assay CV were, respectively: 0.5–100 ng/ml, 1.4–4.9% and 1.3–8.6% for leptin; from 0.78 ng/ml, 7.4% and 2.4–8.4% for adiponectin, and from 0.16 ng/ml, 3.2–7.0% and 7.1–7.7% for resistin.
Descriptive statistics included the number of patients in particular groups and the values of the analysed parameters, expressed as the mean ± SD. For comparison between different groups, all age- and sex-dependent variables were expressed as SDS values. Student’s t-test was applied when distribution of the variable was normal, while if it was different from normal, a non-parametric statistical test (Mann-Whitney U test or Kruskal-Wallis test) was used for comparisons between groups. Correlations were evaluated using the Pearson’s test. Statistically significant differences were accepted when the p-value was below 0.05.
Results
The study group included 129 children (79 girls and 50 boys), aged 6.87 ±1.35 years (mean ±SD); their BW SDS was: –2.32 ±0.34 and birth length SDS (BL SDS) was: 0.04 ±1.37. At that time, their HSDS was: 0.12 ±1.14 and BMI SDS: 0.01 ±1.08, WHtR: 0.47 ±0.04, SBP: 104.65 ±12.77 mmHg, and DBP: 69.37 ±10.85 mmHg. Auxological parameters and test results obtained in the study group and the control group did not differ from each other. Most of the children from the study group (SGA children) had normal glucose concentration during the OGTT, except for 2 whose glucose level at 0’ was 112 mg/dl and 6 whose glucose level at 120’ ranged between 140 and 165 mg/dl. IRIHOMA in the study group was 0.84 ±0.57, while IRIBelfiore was 0.91 ±0.33.
In the analysed group of children with SGA, IRIHOMA and IRIBelfiore exhibited a strong positive correlation with each other (Figure 1). A significant positive correlation was observed between IRIHOMA and HSDS, BMI SDS, WHtR, blood pressure, HDL-cholesterol, triglycerides, C-peptide and leptin concentrations, and a negative correlation with HDL-cholesterol. In turn, a significant positive correlation was observed between IRIBelfiore and HSDS, BMI SDS, WHtR, blood pressure, as well as HDL-cholesterol, C-peptide and leptin concentrations (Table I). C-peptide and cortisol concentration, as well as WHtR and blood pressure, were unavailable for the control group.
Figure 1
Correlation between IRIHOMA and IRIBelfiore in the analysed group of children born SGA, currently aged 6-8 years, with normal height (after catch-up growth phenomenon)
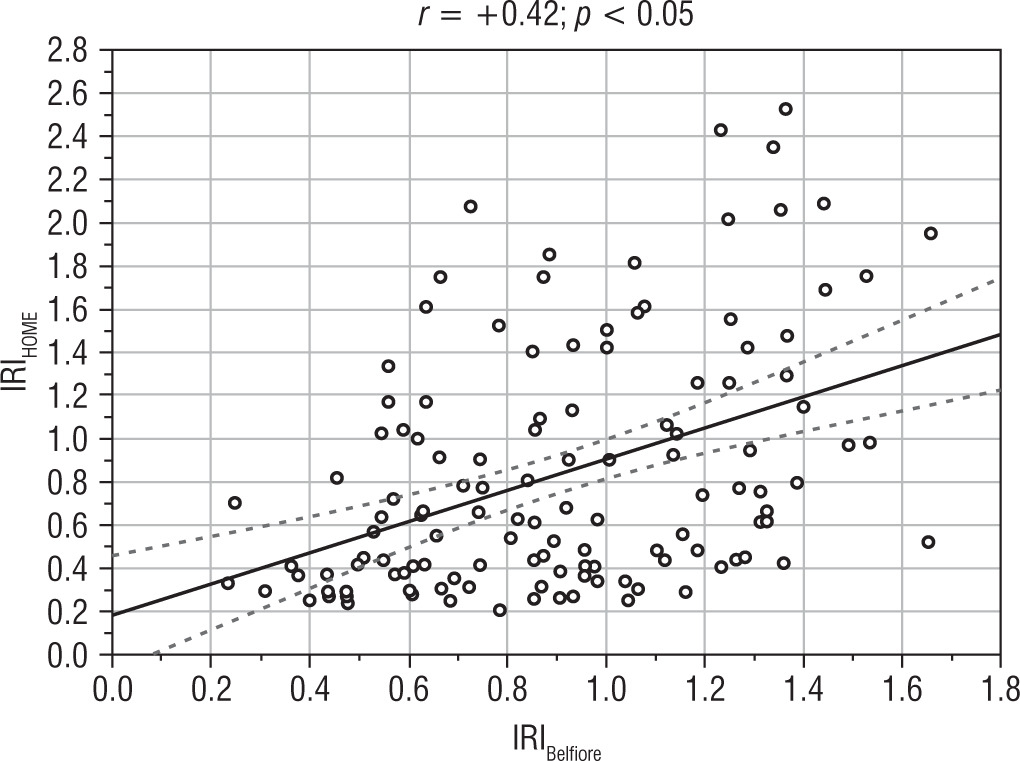
Table I
Correlations between IRIHOMA and IRIBelfiore and selected parameters in the analysed group of children born SGA, currently aged 6-8 years, with normal height (after catch-up growth phenomenon)
[i] In the individual rows of the table, the correlation coefficients marked with asterisks (*) indicate significant differences between each other (p < 0.05). BMI – body mass index; SDS – standard deviation score; WHtR – waist-to-height ratio; HDL-cholesterol – high-density lipoprotein – cholesterol; LDL-cholesterol – low-density lipoprotein-cholesterol
None of the children showed elevated IRIHOMA; however, a total of 29 children (22.5%) had an elevated value of IRIBelfiore. The glucose and insulin concentrations during the OGTT for each child in the analysed group are shown in Figure 2. In children with elevated IRIBelfiore, IRIHOMA concentrations ranged from 0.4 to 2.4 and fasting insulin concentrations from 2.2 to 12.0 uIU/ml.
Therefore, a comparative analysis was conducted between 2 groups of children: one with a normal IRIBelfiore and the other with an elevated IRIBelfiore. The results were also compared to the control group (Table II).
Figure 2
Glucose and insulin results during the OGTT for individual children from the analysed group of children born SGA, currently aged 6-8 years, with normal height (after catch-up growth phenomenon)
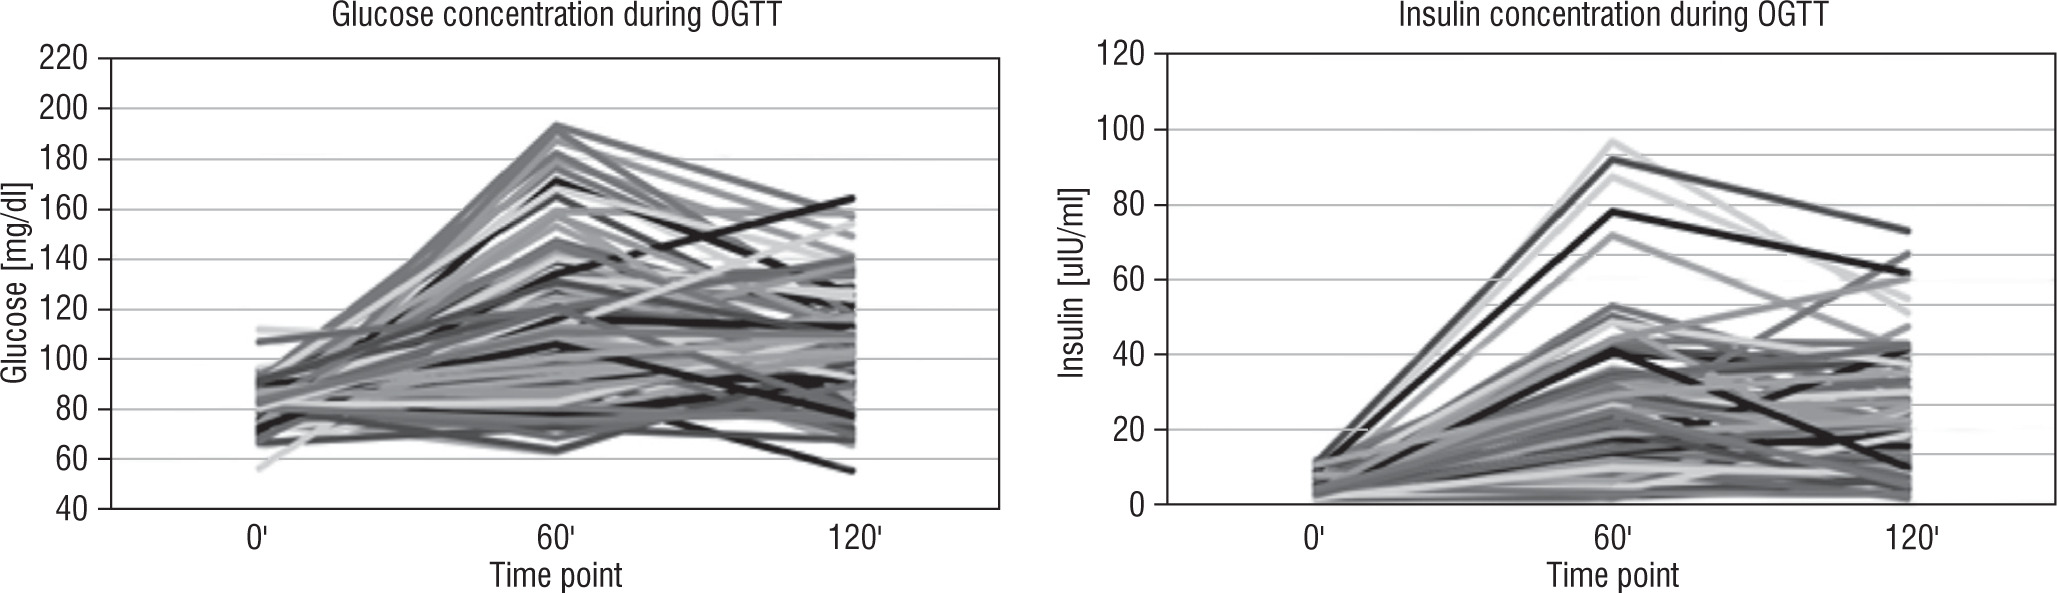
Table II
Comparison of mean values (±SD) of auxological data, blood pressure measurements and laboratory test results depending on normal or high IRIBelfiore in the analysed group of children born SGA, currently aged 6-8 years, with normal height (after catch-up growth phenomenon)
[ii] BMI - body mass index; SDS – standard deviation score; WHtR – waist-to-height ratio; HDL – high-density lipoprotein-cholesterol; LDL-cholesterol – low-density lipoprotein-cholesterol; IGF-1 - insulin-like growth factor 1; IRIHOMA - insulin resistance index according to homeostasis model assessment, NA – not available
The group of children with elevated IRIBelfiore exhibited significantly higher systolic and diastolic blood pressure, as well as significantly lower levels of HDL-cholesterol and HDL/total cholesterol ratio compared to the group of children with normal IRIBelfiore. HDL-cholesterol concentration in children with high IRIBelfiore also differed significantly from the control group. Additionally, children with IR according to IRIBelfiore had significantly higher leptin levels than children with normal IRIBelfiore, although their BMI SDS and WHtR values did not differ significantly between those 2 groups. It is worth noting that the children with elevated IRIBelfiore were taller, although their IGF-1 SDS values were similar to those in the other group. There were no significant differences in birth weight (BW SDS) and birth length (BL SDS) between the 2 groups. The exact relationships between the analysed parameters in these groups are presented in Table II.
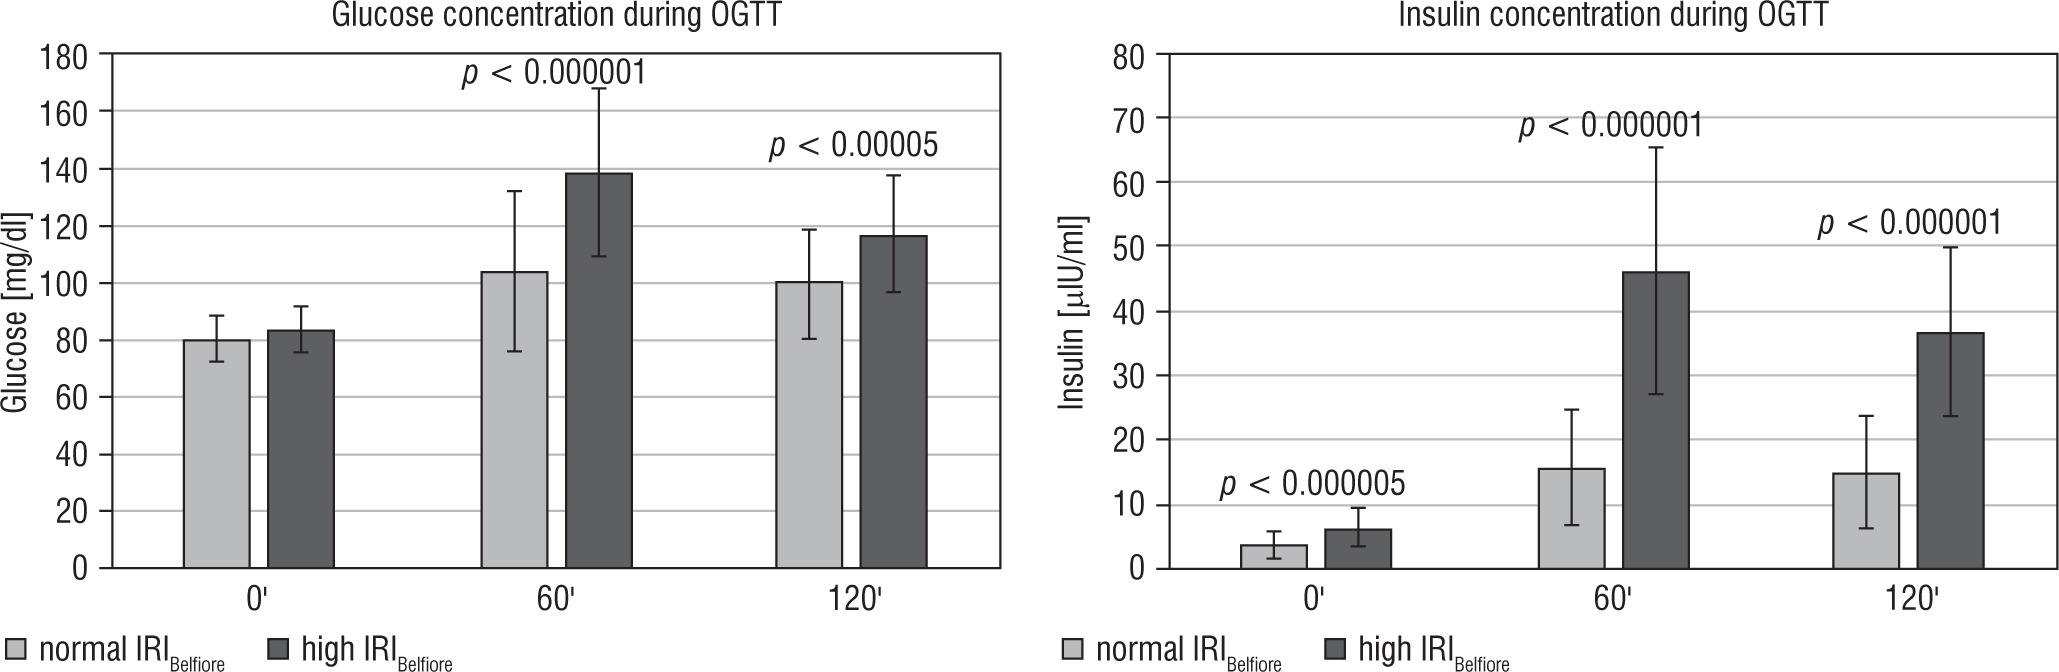
Regarding the results of glucose and insulin during the OGTT, it was found that in the group of children with elevated IRIBelfiore, both glucose and insulin levels were statistically higher at each time point, except for the 0’ point for glucose than in children with normal IRIBelfiore (as shown in Figure 3). Additionally, the IRIHOMA and C-peptide ratios were significantly higher in children with IR diagnosed according to IRIBelfiore. Moreover, IRIHOMA was significantly higher in the group of children with IR diagnosed by the Belfiore than in the control group.
Discussion
It is well known that children born SGA tend to develop metabolic complications, particularly those who exhibit catch-up growth phenomenon during the early years of life [1, 2, 26, 27]. Based on the results obtained in our study, we have determined that in children born SGA, aged 6–8 years, being after catch-up phenomenon, the fasting glucose and insulin concentrations are comparable to those in the healthy population, and the IRIHOMA is not higher than 2.5 in any child.
However, in our previous study [3], we observed features of metabolic syndrome in a group of children born SGA already in the first decade of life. We demonstrated that fasting insulin concentration positively correlates with a higher BMI, waist circumference, blood pressure, as well as abnormal lipid profile and leptin levels. Therefore, it should be considered whether the applied method of assessing insulin resistance, based only on fasting glucose and insulin concentrations, is sufficient.
Firstly, it should be noted that reference values for IRIHOMA in children vary, depending on the studied population. Many authors attempted to establish norms for fasting insulin concentration and for IRIHOMA in children. Peplies et al. [23], based on a study of 16,228 cases of children aged 2-9 years, from 8 European countries, created reference tables and percentile charts for children based on age. In our study, we referred to these norms. On the other hand, Ballerini et al. [24] established a cut-off point for normal and elevated fasting insulin concentration in a similar age group as an insulin level above 10 uIU/ml, suggesting that this value may be a warning sign for paediatricians and an indication to further investigate IR. In our study, 2 children had insulin levels above 10 uIU/ml, whereas there were as many as 29 children diagnosed with IR according to the Belfiore method.
It is important to emphasize that the IRIBelfiore value indicates a slightly different type of IR than that derived from IRIHOMA because it reflects peripheral rather than hepatic insulin resistance [15]. Typically, if fasting insulin levels are elevated, they are also elevated during an oral glucose tolerance test (OGTT) because there is a strong correlation between fasting insulin and insulin at 120 minutes of OGTT, as we demonstrated in our study. However, the most important finding in our study is that many children have normal fasting insulin secretion and IRIHOMA but excessive insulin levels during OGTT. Consistent with the hypo- thesis of a thrifty phenotype in children with SGA [1], peripheral IR is observed in a poorly nourished foetus, primarily affecting muscle cells. This is to ensure an adequate supply of glucose to vital organs, such as the brain. Thus, after birth, children with SGA develop persistent peripheral IR first, and only later, especially in those gaining weight rapidly, may develop hepatic IR, as well. Therefore, relying only on IRIHOMA for IR assessment seems to carry the risk of overlooking peripheral IR in some patients.
In our study, the IRIHOMA values in the entire group were found to be comparable to those observed in the control group, and none of the children exhibited insulin resistance according to IRIHOMA formula. Similar results were observed in our earlier study [13], in which we compared the results obtained for prepubertal SGA children with currently normal growth to those obtained for children born SGA who did not exhibit catch-up growth phenomenon, and children born AGA, both with short stature and growing normally [13]. On the other hand, a tendency towards higher IRIHOMA values was recently described for preterm SGA compared to preterm AGA infants, as early as in the first decade of life [28]. As mentioned before, in our earlier study, we observed a significant number of SGA children with components of metabolic syndrome already during the prepubertal period. This mainly included abdominal obesity and elevated blood pressure, accompanied by increased insulin levels during OGTT [3].
Moreover, according to other authors, an increasing number of metabolic syndrome components are associated with lower insulin sensitivity and altered β-cell function, as indicated by IR indexes calculated from both fasting glucose and insulin concentrations, as well as during the oral glucose tolerance test [29].
Therefore, we were considering whether, in addition to measuring fasting glucose and insulin levels, it was worth recommending an OGTT with IR assessment as a screening test for all children born SGA who underwent catch-up growth phenomenon and at that time had normal growth.
In our study, we found that in many children IR may be identified by the Belfiore method, even when both fasting insulin concentration and the IRIHOMA were normal. Although the euglycaemic hyperinsulinaemic clamp is a well-known and commonly recognised gold standard in insulin resistance evaluation, the method requires special equipment, is rather expensive and time consuming, and is tedious for the patient. Out of all the methods of IR evaluation by OGTT [30] the Belfiore method appears to be the preferential option for comparing glucose and insulin concentrations with median values for a given pubertal group in a given population, which seems necessary for the evaluation of insulin secretion in prepubertal children [16,17]. Resistance to insulin is a known risk factor for diabetes mellitus type 2 development. Thus, it is worth recommending this test in all children born SGA, as early as in first decade of life, to determine whether any of them had peripheral IR.
As mentioned earlier, in the currently analysed group of children, we found IR based on the IRIBelfiore in 22.5% of SGA children. In that group, we observed a significantly higher blood pressure, higher leptin levels, worse HDL-cholesterol levels, and higher growth, compared to the SGA children who had a normal IRIBelfiore value.
The impact of elevated insulin on blood pressure in children was also demonstrated in the study by Gryko et al. [31], in which higher, statistically significant values of IRIHOMA were found in children with hypertensive parents.
The influence of altered adiponectin levels on increased insulin secretion has previously been emphasized in many studies. Zamojska et al. [32] found that adiponectin and leptin levels were significantly higher in the SGA group compared to the AGA group, while resistin values were comparable between the 2 groups of patients. According to the results of this study, adiponectin levels were negatively correlated with blood pressure. In our research, we did not detect differences in adiponectin levels between SGA children with high and low IRIBelfiore, but we found that those children had elevated leptin levels, despite no statistical differences in terms of BMI and WHtR. As mentioned before, IR can be an important risk factor in the development of further metabolic disorders in children with SGA [7]. Previous studies have shown a positive correlation between leptin and insulin resistance [33-35]. However, there are limited publications that evaluate the relationship between leptin concentrations and the indices of IR in children with SGA. Miras et al. [36] observed a positive correlation between leptin concentration and HOMA-IR in a group of SGA children with catch-up growth but not in those in whom this phenomenon was not observed. This suggested that elevated leptin levels in that group might play an adaptive role in facilitating catch-up growth. A similar relationship was noted in the study by Jaquet et al. [37] and by Challa et al. [38].
Summing up, the results of our study show that over 20% of children born with SGA exhibit peripheral IR, detected by IRIBelfiore during OGTT. This group is characterized by increased insulin secretion during OGTT, which cannot be detected by IRIHOMA. These children also tend to have higher blood pressure, dyslipidaemia, and leptin resistance, despite being within the normal range for weight and waist circumference. In these cases, abnormalities observed in auxology and laboratory tests may contribute to the development of subsequent metabolic complications. Therefore, it is crucial to implement specific preventive measures at this stage, including strict adherence to recommendations regarding diet and physical activity. It appears worth recommending IRIBelfiore as a valuable diagnostic tool for identifying IR in children aged 6–8 years who were born SGA.
Conclusions
Based on the obtained results, it is challenging to determine whether OGTT with IR assessment should be routinely recommended for the prevention of metabolic complications in children born with SGA. However, our findings do contribute to the ongoing discussion regarding recommendations for managing children with SGA. Higher values of blood pressure, insulin, and leptin, as well as lower HDL-cholesterol levels, observed in the group of children with IR detected on the basis of the OGTT results, emphasize the importance of this study and the acquisition of awareness of the need to implement preventive measures in the first decade of these patients’ lives.