Introduction
Specific changes within the human body observed during the ageing process include the acceleration of the bone resorption as well as the increasing muscle mass dysfunction. BMD (bone mineral density) drop accompanied by muscle weakness (↓ mass, strength, and muscle function) significantly increases the probability of fragility fracture occurrence, subsequent disability, and can finally lead to dependence and a major decrease in quality of life [1]. The growing predominance of bone resorption processes over bone formation is associated with the risk of osteoporosis – lack of bone mass, impaired bone microdamage repair system, and subsequent low-energy (fragility) fractures [2]. Women are 4 times more likely to be affected by osteoporosis when compared to men [3]. The above-mentioned predominance of the resorption processes, lasting until the end of life, causes women to lose approximately 55–60% of their trabecular bone mass and 35–40% of their cortical bone [4]. Whereas, in men the loss was reported at 30% and 20%, respectively [5]. Currently, standards for identifying those at risk of osteoporosis and subsequent low-energy fractures include dual X-ray absorptiometry (DXA) of BMD performed at 2 locations: L1–L4 spine and proximal femur [6]. It has been established that so-called osteoporotic fractures are associated with a major economic (€37.5 billion in 2017 in 5 largest European countries + Sweden – EU6) and medical burden (fourth reason in the EU6 for disability-adjusted life years) [2]. At the same time, according to Siris et al., up to 70% of fractures occur in those with non-osteoporotic BMD score leaving them outside the scope of the treatment guidelines [7]. To improve the identification process of those at high risk, FRAX (Fracture Risk Assessment Tool) was introduced followed by a development of the Trabecular Bone Score (TBS – indirect bone microarchitecture assessment tool) [8]. Both FRAX and TBS have proven their efficiency in identifying high-risk patients, but, at the same time, authors suggest that due to the shortcomings of those tools, further studies are required to improve the identification process [9]. The limitations of the above-mentioned include, among others, the accessibility of DXA scanners and TBS software and time dedicated to patients at the specialist office within the public healthcare system. In search of the new potential tool to improve the identification process of those at risk of fragility fractures, some authors proposed to use the interconnectivity between bone and muscle tissue. Among the proposed tools the authors pointed out handgrip strength (HGS) as a non-expensive and easy to implement apparatus [10]. HGS measured with a hand-held dynamometer is commonly used to assess muscle strength and the patient’s functional capacity. HGS has proven its efficiency in the assessment of muscle-skeletal system and the probability of some negative health-associated conditions [11]. When considering the utility of HGS in clinical practice, authors remain divided [12–14].
The relationship between HGS and quality of skeletal system in the population aged 50+ years (both women and men) remains unclear. The heterogeneity of the studies followed by small study groups adversely affects the conclusion-drawing process in terms of HGS utility (recognising its high accessibility and low cost). In order to follow the matter, the authors decided to conduct the following study on the relationship between muscle strength (HGS) and bone system (BMD, reported fragility fracture) in a large population (aged 50+ years) according to sex.
Material and methods
This study was conducted in accordance with the principles of the Helsinki Declaration of the World Medical Association after appropriate consent from the Jagiellonian University Bioethics Committee (no. 1072.6120.70.2022 from 21 April 2022) had been obtained. A total of 20,776 patient records were collected from the database of Cracow Medical Centre (CMC). The group consisted of patients of CMC in the period 2008–2021. Questionnaires regarding the patients’ history (basic anthropometric data along with past and ongoing medical conditions) were collected at admission. This included history on fractures with the emphasis on fragility fractures. If a fracture was the result of a trauma or a high impact car accident, it was not included in the analysis. Four types of fractures were taken into consideration for further analysis – Colles’, vertebral, hip, and proximal humerus. Additionally, most patients from this group underwent a DXA examination (Hologic, Horizon W, Bedford, USA) and/or handgrip testing with a handheld dynamometer (Baseline 12-0240, NY, USA). All HGS as well as BMD testing was done following a pre-defined protocol by the same trained technician with over 20 years of working experience. Protocol for DXA examination was based on the guidelines provided by the Hologic manufacturer and best clinical practices [15]. Scans were done at locations indicated by the International Society for Clinical Densitometry (ISCD) – lumbar spine (L1–L4) and/or femoral neck. The study protocol for HGS stated that it should be conducted in a standing position with the elbow joint of the tested limb bent to 90° and the forearm in a neutral position. Each patient was allowed 2 attempts (one-minute break between them) with the higher score being included in the chart.
After applying specific inclusion/exclusion criteria, a total of 7159 records were included in the study. Inclusion criteria were as follows: available result of L1–L4 and/or neck BMD, age 50+ years, handgrip score, and written consent from the patient to use the collected information for scientific purposes. Exclusion criteria included age < 50 years, lack of important data in the database (apart from the above mentioned – BMI (body mass index), age, sex, history of fractures), severe cognitive deficits, and period between the questionnaire being collected and BMD/HGS examination > 12 months.
Statistical analysis was conducted with Statistica 13 using tests suitable for the distribution of data, i.e. χ2 (Pearson), Student’s t, U Mann-Whitney, Spearman’s rank correlation coefficient, comparison of average values/median, and analysis of variance (ANOVA). Values of p < 0.05 were considered to be statistically significant.
Results
A total of 7159 patients were included in the study, the majority of whom were women (5745 vs. 1414 men). Detailed descriptive information on the analysed data are presented in Table 1.
Table 1
Characteristics of the study group
Following the ISCD and World Health Organisation (WHO) guidelines, most patients were identified as having a normal (1403/24.4% of women and 518/36.6% of men in the study group) or osteopenic (accordingly 2663/46.4% and 661/46.7%) BMD result. Osteoporosis was diagnosed in a total of 1914 patients (26.7% of all cases) in the study group (including 1679/29.2% of the female and 235/16.6% of the male analysed population). Depending on the diagnosis (norm-osteopenia-osteoporosis) there was a significant difference in HGS between the 3 identified states (Me 27-25-23 kg; p < 0.001). However, after taking sex into consideration the difference was still observed only in the female population (accordingly Me 24-22-21; p < 0.001) but not male population (Me 37-36-35; p = 0.113).
As expected, the handgrip score was generally significantly higher in the male population and was more closely correlated with age then with other analysed variables, including BMI (Table 2). HGS was significantly correlated with both BMD neck and spine in women and with BMD neck in the male population; in all cases the correlation was considered weak.
Table 2
Spearman rank coefficient correlations between handgrip and other data in the study group
| Variables | Handgrip | |||
|---|---|---|---|---|
| Men | Women | |||
| R | p | R | p | |
| Age [years] | –0.36 | < 0.001 | –0.33 | < 0.001 |
| BMI [kg/m2] | 0.03 | 0.251 | 0.001 | 0.887 |
| BMD spine [g/cm2] | –0.02 | 0.398 | 0.1 | < 0.001 |
| BMD neck [g/cm2] | 0.11 | < 0.001 | 0.2 | < 0.001 |
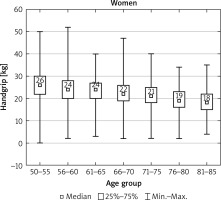
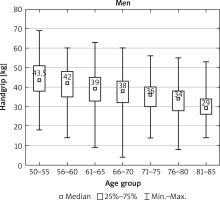
After dividing the patients into age groups (four cases 85+ years old had been in this case identified as outliers and were withdrawn from the analysis), HGS presented a clear decline with age in both sexes (Figs. 1, 2).
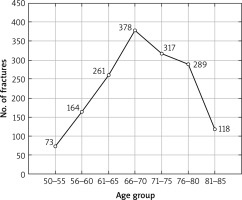
Age-dependent decline was also observed in BMD, but it was more distinct in BMD neck and women population. Our study shows that the highest percentages of fractures were reported within the age subgroups of 65–70 and 71–75 years (p < 0.001) (Fig. 3).
Fig. 3
Number of patients who reported fragility fractures in the study population; χ2 test; p < 0.001

A total of 1600 people in the study group reported a fracture via their health questionnaire. The presence of a fracture was associated with advanced age (Me 69.3, 64–76 vs. 66.8, 61–73; p < 0.001), but it did not correspond to BMI (Me 27.5, 25–31 vs. 27.7, 25–31; p = 0.668) in our study population. The age difference between those with and without a reported fracture was more noticeable in females (Me 69.5, 64–76; p < 0.001) than in males (Me 69.9, 66–75 vs. 69, 63–74.5; p = 0.032).
A higher number of fracture cases was seen in women (23.5% of the female study population vs. 18.2 in males). The most common fractures included Colles’ (877) and vertebral (435) fractures followed by humerus and hip (177 and 131, respectively). In our study group, HGS was significantly higher for all the analysed fracture sites in the no-fracture group of women. At the same time, there was no such relationship in reference to the male population (Table 3). It should be emphasised that, although the differences were significant in some cases (like Colles’ fracture), they were rather minor.
Table 3
Median handgrip score and types of fragility fractures in male and female populations
Discussion
The following study confirms an age-related decrease of HGS associated with a progressive decline of skeletal muscles (both in mass and muscle strength). Significant correlations were observed both in men (R = –0.36) and women (R = –0.33). In our previous studies on a group of 120 postmenopausal women (with an average age of 69.3 years) this relationship was also noticed (R = –0.22, p < 0.05) [15]. Studies by other authors also highlight a significant HGS decrease with age [16–18]. Sonnefeld et al. reported lower values of HGS in a group of women aged 65+ years (n = 115) when compared with a younger age group (n = 83) [16]. Similar results were observed in larger study of 1342 (Kamiya et al.) and 337 (Kim et al.) postmenopausal women (↑ age = ↓ HGS) [17]. When the female population was accompanied by males in the study (n = 159), authors reported that muscle deficits were negatively associated with age, regardless of sex (p < 0.05) [18]. As one might expect, the muscle strength measurements in the male population were significantly higher than in the group of women, both in the study herein and in those by other authors [19–21].
As one of the steps in our study, we assessed the possible relationship with BMD using osteoporosis-specific diagnostic criteria (thus differentiating patients to norm, osteopenia, and osteoporosis). Significant differences (↑ BMD = ↓ HGS) were identified at that point, but only in our female population (p < 0.001), contrary to the male one (p = 0.113). Similar results were reported by Taniguchi et al. in a study of 265 postmenopausal women (mean age 75.5 years) with and without osteoporosis (n = 72). Osteoporotic patients generally presented lower HGS scores when compared with a non-osteoporotic group; however, the difference was not substantial and was not found to be statistically significant (19.8 vs. 20.6 kg; p = 0.154) [22]. It should be noted that the possible disparity between the 2 might be caused by a major difference in the number of patients enrolled into the studies.
In our study, we found a weak but significant correlation between the spine and hip BMD with HGS in the women group (R = 0.1, r = 0.2, respectively; p < 0.001) whereas in men it was confirmed only for hip BMD (R = 0.1; p < 0.001). Similar results have been reported by Kamiya et al. (postmenopausal women). When the authors divided the patients into 3 subgroups on the merit of their HGS, it became clear that higher HGS scores are significantly associated with higher BMD values, both in hip and spine [17]. Contrary to the above study, Nagaoka et al. did not identify significant differences for BMD in the female or the male population in reference to HGS [18]. It is our opinion that this might be partially explained by a relatively small study sample followed by the use of fixed cut-off points.
It should be emphasised that there is a plethora of studies confirming the relationship between HGS and BMD both in the bones surrounding the wrist and the distal bones, not directly connected with the muscles affecting the grip [23–28]. Osei-Hyiaman et al. confirmed a relationship in their study of 1168 postmenopausal women with the analysis between HGS and metacarpal BMD (R = 0.2474, p < 0.001) [23]. Di Monaco et al. also found a strong correlation in their study sample of 102 women (R = 0.576; p < 0.001) between HGS and the BMD of distal radius [24]. When a younger population (n = 143, mean age 34 years) was taken into consideration, a relationship was confirmed between HGS and phalanx BMD but only in the male population (right hand R = 0.44, left hand R = 0.378; p < 0.05) contrary to the female population [25]. The authors believe that the disparities in this case might be explained by the proper levels of oestrogens, clouding the possible relationship.
Our results (correlations between HGS and spine/hip BMD) were also observed in the NHANES studies (2013–2014). As part of their study, the authors performed handgrip measurements in a total of 2720 subjects (1359 men and 1361 women) aged ≥ 40 years, finding significant correlations with both hip (total: R = 0.482; neck: R = 0.427) and spine BMD (R = 0.312) in all participants [26]. It is our belief that the stronger correlation might be affected by the younger population that was studied (mean 58.6 vs. 67.3 years in our study). This hypothesis might be supported by the Park et al. studies focused on an elderly demographic (mean 72.4 years, 192 women), in which correlations were reported as statistically significant, but they were weaker than in the previous study (R = 0.268 and 0.427 in spine and hip, respectively). It should be also emphasised that the Park et al. study used computer tomography as a measurement tool (qCT) [27]. Similar results were reported in adolescents (n = 342). Contrary to our results, Aydin et al. found a relationship between HGS and BMD (measured in bones proxy to handgrip – radius and ulnar) in the male population (n = 134) but also lumbar spine and femoral neck [28].
During our research it was discovered that there are significant differences in HGS score between those with and without a fragility fracture (lower HGS = higher chance to have a fragility fracture). These were observed in most of the analysed sites (any fragility fracture, hip, vertebral, Colles). However, after the group was divided into the male/female population, the significance was upheld only in the female population (including humerus fracture, not seen in a previous analysis) but not among men. At the same time, it should be mentioned that despite their statistical significance, the differences were not major. According to the study by Kamiya et al. (n = 1342, mean age 63.4 years), those with lowest HGS score reported have an average of 7.2% higher risk of being recognised as a person with fragility fracture when compared to those with the highest HGS values (p < 0.001) [17]. When it comes to the female population, our findings are corroborated by Kim et al. and Zanchetta et al. – both based on a postmenopausal female population [29, 30]. Similar results were also confirmed in a group of 340 women and men over 50 years of age (mean age 70.0 years). Significantly (p < 0.001) lower HGS values were documented in the group with a low-energy fracture compared to the healthy group [31].
Despite our best efforts, our study had some limitations, most of which were associated with the retrospective nature of the study. Due to this, we were unable to conduct continuous assessment on the proper execution of every examination. Simultaneously, the person in charge of DXA scans and handgrip assessment was an experienced certified professional. Our knowledge on the fractures was based on the self-reported health questionnaires collected at admittance. At the same time, due to the nature of the facility (centre treating patients with osteoporosis), the employees took great caution when it comes to information on fractures (to properly identify them as a high- or low-energy fractures). Due to the anonymous nature of the study, the authors did not have a possibility to follow-up with potential inconsistencies within the collected health questionnaires. If this occurred, the participants were removed from the database.


