Introduction
Left ventricular assist devices (LVADs) serve as mechanical circulatory support and are used as a bridge to heart transplantation for patients with heart failure refractory to medical management [1]. In addition to device-associated and cardiovascular disorders, infections and bleeding remain the most common complications [2, 3]. In a meta-analysis by Draper et al., the prevalence of gastrointestinal bleeding in LVAD patients was reported to be 23% [4]. Left ventricular assist device patients have several risk factors that lead to gastrointestinal bleeding mediated by distinct mechanisms. First, they are at higher bleeding risk imparted by anticoagulants to achieve a higher international normalized ratio (INR) goal of 2.0–3.0 and concurrent aspirin use to prevent thrombosis [5]. Second, mechanical circulation due to LVAD leads to shear stress that results in cleavage of von Willebrand factor (vWF), leading to acquired vWF deficiency [6, 7]. In addition to homeostasis, vWF plays a role in controlling angiogenesis, and unchecked vessel formation leads to angiodysplasias throughout the GI tract [8].
Non-variceal upper gastrointestinal bleeding (NVUGIB) is the most common reason for emergency room visits for gastroenterology. It is responsible for more than 250,000 hospital admissions annually in the USA, with an estimated 2–10% mortality [9–11]. LVAD-associated gastrointestinal (GI) bleeding has been associated more with the upper GI tract than with the lower GI tract [4, 12]. Readmissions after NVUGIB in LVAD patients incur greater resource utilization compared to index admissions [13]. Similarly, Abougergi et al. showed that readmissions associated with NVUGIB overall do not carry a favourable prognosis [14].
Aim
Therefore, we sought to undertake this study to appraise the differences in the 30-day readmission rate of NVUGIB in patients with and without LVAD. Moreover, we also compared the hospital outcomes and resource utilization among readmitted patients in both groups and identified predictors of 30-day readmission in the LVAD group with NVUGIB.
Material and methods
Data source
We used the National Readmission Database (NRD) 2018, which contains data on 17.7 million stays at 2430 hospitals in 28 states in the United States of America (USA). It consists of weighted observation from the hospitals across the states, clustered into strata to produce national estimates. The National Readmission Database is created and maintained by the Healthcare Cost and Utilization Project (HCUP). HCUP is owned by the Agency for Healthcare Research and Quality (AHRQ). It is designed as a stratified probability sample that is representative of all non-federal acute care hospitals nationwide. Among publicly available databases, NRD represents the largest medical database. According to the U.S. Census Bureau data, the 2018 NRD entails 59.7% of the U.S. population and 58.7% of U.S. hospitalizations as described in the American Hospital Association (AHA) Annual Survey Database [15]. International classification of diseases tenth revision clinical modification (ICD-10-CM) codes were used to identify patients. In NRD 2018, hospitals are stratified according to various hospital and geographic variables. A 20% probability sample of patients from all hospitals is then collected. Those hospital discharges are registered, and information about the patient’s characteristics, principal and secondary diagnoses, and resource utilization, including length of stay, readmission, procedures performed, and total hospitalization costs and charges, are entered into the NRD. Each discharge is then weighted (weight = total number of discharges from all acute care hospitals in the United States divided by the number of discharges included in the 20% sample), which makes estimates drawn from the NRD nationally representative. Each hospitalization encounter contains multiple hospital- and patient-related variables, including up to 40 diagnosis codes and 25 procedure codes. The recommendations issued by the HCUP were used to identify index admissions and readmissions. The diagnosis code used to indicate the reason for hospitalization is referred to as the principal diagnosis, and secondary diagnoses were indicated by ICD-10 codes other than the principal diagnosis. Institutional Review Board approval was sought, but the study was deemed exempt due to the use of de-identified, publicly available data.
Patient selection
The NRD contains admissions without linking these to the previous year. So, we included all patients with index hospitalization with diagnosis codes for NVUGIB between January and November 2018. The NRD database was searched to find patients with a history of LVAD. Elective or planned readmissions were excluded, and only adult patients aged 18 years or older were taken. ICD-10-CM codes were used to find patients fulfilling inclusion criteria. We also eliminated patients who were discharged in the month of December of each year (to get a 30-day period to track readmissions post discharge) and those who died during the index hospitalization. Patients readmitted within 30 days after NVUGIB were identified and served as the 2 study groups to compare resource utilization and hospital outcomes.
Outcomes
We calculated the all-cause 30-day readmission rates of NVUGIB in patients with and without LVAD along with the top 10 causes of readmission. Through 30 days of the index admission, each non-traumatic admission for any principal diagnosis was considered as a readmission. If a patient had several readmissions within 30 days of discharge, only the first encounter was counted as readmission. The endoscopic procedures performed were also compared. Because LVADs are also associated with bleeding mucosal lesions in the small intestine (15% of the instances), enteroscopy was also compared between the study groups [4, 16]. Other outcomes compared among readmitted patients were as follows: (1) mortality, (2) hospital length of stay (LOS), (3) packed red blood cell (pRBC) transfusion, (4) platelet transfusion, (5) total hospitalization charges and costs, (6) acute kidney injury (AKI), (7) vasopressor requirement, (8) intensive care unit (ICU) admission, and (9) parenteral feeding. LOS and total hospitalization charges are variables directly coded in the NRD. The appendix lists the ICD-10 codes used to identify patients for the rest of the secondary variables and the ICD-10- CM procedure codes used to identify procedure-related secondary variables. The Healthcare Cost and Utilization Project provides data that contain hospital-specific cost-to-charge ratios based on all-payer inpatient costs. This cost information is obtained from the hospital accounting reports collected by the Centers for Medicare and Medicaid Services [17].
Statistical analysis
Analyses were performed using STATA, version MP 14.2 (StataCorp, College Station, Texas, United States). The NRD is founded on an intricate sampling design that includes stratification, clustering, and weighting. This software facilitates analysis to generate unbiased results with p values that are nationally representative. The weighting of patient-level observations was applied to procure estimates for the entire population in the United States of hospitalized patients with NVUGIB for the data studied. Pearson χ2 test was used for categorical variables to compare baseline characteristics between the 2 study groups, while Student’s t-test was used for continuous variables. The survival analysis was conducted with time from discharge to readmission as the time variable, and with readmission as failure. We used univariable Cox regression analysis to compute unadjusted hazards ratios (HRs) for 30-day readmission. Multivariate Cox regression models were built by including all variables that were significantly associated with the outcome on univariable analysis with a cut-off p-value of 0.2 [18]. Variables deemed clinically important to the outcome based on literature review were included in the model irrespective of whether they were significantly associated with the outcome on univariable analysis. The variables adjusted for in the regression models were as follows: gender, age, Charlson Comorbidity Index score, median household income for patients’ zip codes, hospital location/bedside, hospital volume, and teaching status. Survival analysis was performed to study the readmission rate. Multivariable Cox regression analysis was used to identify predictors of readmission. Proportions were compared using the Fisher exact test for the other calculations, and continuous variables were compared using Student’s t-test. All p values were 2-sided, with 0.05 as the threshold for statistical significance.
Results
Baseline characteristics
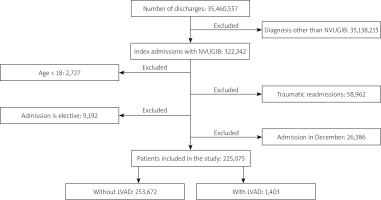
Figure 1 shows the flow diagram for study inclusion criteria. The total number of patients in the studied NRD cohort was 35,460,557, among whom 322,342 (0.91%) had a diagnosis of NVUGIB. In 2018, a total of 42,628 LVAD procedures were performed, but among NVUGIB, 1403 (0.43%) had a history of LVAD (Table I). Patients with NVUGIB without a history of LVAD were more likely to be older and female, were more likely to be insured by Medicaid or private insurance, and had minor differences in median annual income compared to NVUGIB patients with LVAD history. NVUGIB patients with LVAD also had higher Charlson Comorbidity Index scores. There were numerically small but statistically significant differences in the hospital characteristics between the 2 groups: overall, NVUGIB patients were more likely to be admitted to small, medium, and large-sized hospitals, but further analysis showed higher admission trends in LVAD patients for hospitals classified as teaching and metropolitan hospitals. In addition, NVUGIB patients had a longer LOS in all categories. Among comorbid conditions, there were differences in the prevalence of atrial fibrillation, atrial flutter, history of percutaneous coronary intervention (PCI)/stent, diabetes mellitus, hypertension, coronary artery disease, coagulopathy, and chronic kidney disease between the 2 groups. The other characteristics were similar between the 2 patient groups or had differences numerically too small to be clinically significant.
Figure 1
Patient selection flow diagram
NVUGIB – non-variceal upper gastrointestinal bleeding, LVAD – left ventricular assist device.

Table I
Patients characteristic
30-day readmission rate
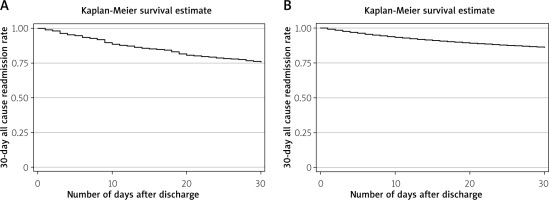
The total time at risk was 17,869 days for NVUGIB patients with LVAD and 5,072,061 for patients without LVAD, with the first readmission occurring at day one and the last readmission at day 30. Figure 2 shows the Kaplan-Meier survival curve. The 30-day all-cause readmission rate was 23,341 per 100,000 NVUGIB patients with LVAD and 13,925 per 100,000 patients for NVUGIB without LVAD. Among NVUGIB patients with a history of LVAD, 24.31% of patients were readmitted, while only 13.92% were readmissions for patients with NVUGIB index admissions (p < 0.001).
Figure 2
Kaplan-Meier curve for 30-day all-cause readmission among patients with non-variceal upper gastrointestinal bleeding. A – Non-variceal upper gastrointestinal bleeding patients with left ventricular assist device; B – non-variceal upper gastrointestinal bleeding patients without left ventricular assist device

Causes for readmission
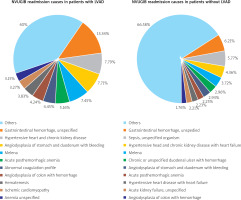
The most common 5 principal diagnoses for readmission with ICD-10 codes for patients with LVAD were gastrointestinal haemorrhage, unspecified: K92.2 (13.34%), hypertensive heart and kidney disease: I13.0 (7.79%), angiodysplasia of the stomach and duodenum with bleeding: K31.811 (7.71%), melena: K92.1 (7.47%), and acute post-haemorrhagic anaemia: D62 (5.16%). We also listed the top 10 causes in chronological order are presented in Figure 3. The top 5 causes of readmission for patients without LVAD for index cases of NVUGIB were gastrointestinal haemorrhage, unspecified: K92.2 (6.21%) sepsis, unspecified organisms: A41.9 (5.77%), hypertensive heart and kidney disease: I13.0 (4.36%), melena: K92.1 (3.72%), and chronic or unspecified duodenal ulcer with haemorrhage: K26.4 (2.96%). Among all NVUGIB readmission, 17.55% were attributed to GI bleeding-related causes, while 36.58% were GI bleeding-related readmission in patients with LVAD history who had NVUGIB during the index admission.
In-hospital procedure
For patients with NVUGIB with a history of LVAD, an in-hospital EGD without therapy (diagnostic endoscopy) was performed in 41.63% of patients, while it was performed for 51.11% of patients without LVAD (p = 0.04) (Table II). LVAD patients with NVUGIB required endoscopic therapy more than patients with NVUGIB without LVAD (28.91% vs. 17.15%, p < 0.001). The rate of early (within 24 h) EGD (including both diagnostic and with intervention) performed was not different between the 2 groups (30.63% vs. 37.25%, p = 0.10). In contrast to diagnostic EGD, enteroscopy without therapy was performed more in patients with NVUGIB with LVAD (6.25% vs. 2.05%, p < 0.001). Interventional enteroscopy (involving administration of endoscopic treatment) for NVUGIB was required more in LVAD patients (31.29% vs. 16.55%, p < 0.001). The need for enteroscopy overall was 2 times greater in NVUGIB patients with LVAD (37.50% vs. 17.68%, p < 0.001). The need for radiography-guided embolization for bleeding vessels was similar between the 2 groups (0.41% vs. 0.46%, p = 0.90).
Table II
In-hospital procedures
Resource utilization
Markers of resource utilization were total hospitalization costs, total hospitalization charges, pRBC transfusion, platelet transfusion, and parenteral nutrition, in addition to endoscopic procedures. Evaluation of the mean total hospitalization charges for NVUGIB patients showed that these were $77,985 (95% CI: $61,965–$94,004) for LVAD patients, and $50,065 (95% CI: $48,416–$51,713) for patients without (p < 0.001) (Table III). Similar results were found when examining total hospitalization costs for NVUGIB in patients with and without LVAD: $17,969 (95% CI: $15,157–$20,781) and $11,787 (95% CI: $11,530–$12,043), respectively (p < 0.001). Requirement of pRBC transfusion (overall and within the first 24 h) was not different between the 2 groups (0.41%, 95% CI: 0.27–0.54 vs. 0.40%, 95% CI: 0.38–0.42, respectively, p = 0.88). Similarly, both groups did not differ in their need for platelet transfusion or parenteral nutrition (0.006% vs. 0.016%, p = 0.1 and 0.34% vs. 0.65%, p = 0.51).
Table III
Hospitalization outcomes
Treatment setting and length of stay
The mean LOS for NVUGIB patients showed that it was 6.95 days (95% CI: 6.09–7.81) for LVAD patients and 4.78 days (95% CI: 4.70–4.87) for patients without (p < 0.001). ICU stay was required for NVUGIB-related admissions in 0.77% of LVAD patients and 1.84% of patients without (p = 0.2). However, the use of vasopressors was found to be greater in LVAD patients (3.88% vs. 0.53%, p < 0.001).
Mortality and morbidity
There were no differences in mortality and morbidity between the 2 subgroups. The inpatient mortality from NVUGIB due to any cause in LVAD patients was 1.51% (95% CI: 0.49–4.47%) and 4.49% (95% CI: 4.22–4.77%) in non-LVAD patients, with a p-value of 0.36. The overall rate of acute kidney injury (AKI) was 26.84% and 24.14% among patients with and without LVAD, respectively, but this difference was not statistically significant (p = 0.47).
Independent predictors of 30-day readmission
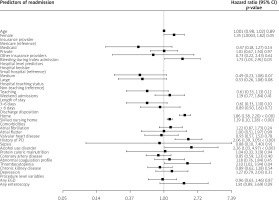
We employed univariate Cox regression analysis to test the association of multiple variables for readmission. The final model is described in the Figure 4 after testing multiple hospital-, patient-, and treatment-level variables. The variables found to be independently associated with 30-day readmission were female gender, bleeding during the index hospitalization, discharge from hospital to home or skilled nursing facility, history of percutaneous coronary intervention, thrombocytopaenia, and alcohol use disorder. The variables found to be associated with lower odds of 30-day readmission were 25–50th percentile median income in the patient’s zip code, micropolitan hospital location, and leaving against medical advice. The rest of the variables did not influence 30-day readmission.
Discussion
We queried the National Readmission Database, the largest all-payer dataset from 2018, to identify the readmission rate and readmission causes in NVUGIB patients with and without LVAD. We discovered that NVUGIB patients with LVAD had a higher readmission rate (24% vs. 13.92%) than the patients without LVAD. In addition, gastrointestinal bleeding was the most common cause for readmission in both groups, and the patients with LVAD required therapeutic endoscopic intervention more often than patients without (28.55% vs. 17.1%, respectively). We further observed that patients with LVAD dictate increased hospital resource utilization among readmissions, including hospital LOS, hospital charges, and hospital costs. Interestingly we did not encounter any statistically significant disparities in all-cause mortality in both study groups, as was the case of pRBC and platelet transfusion and parenteral nutrition.
Our study found that the 30-day readmission rate in NVUGIB patients is 13.9%, which is consistent with the former studies performed by Abougergi et al. and Strömdahl et al., in which the readmission rate was 13% and 16%, respectively [14, 19]. We also examined the 10 most frequent causes of readmission in NVUGIB patients. We discovered that 17.55% of the readmissions were due to gastrointestinal bleeding. These results are also reinforced by the study performed by Abougergi et al., in which 18.5% of readmissions were due to gastrointestinal bleeding [14]. We further analysed the readmission rate in patients who had a history of LVAD placement and were admitted for NVUGIB. We found that 24% of these patients were readmitted within 30 days, and gastrointestinal bleeding was the cause for readmission in 36.58% of patients. Similar results have been observed in a study performed by Carnicelli et al., who reported that 32.7% of readmissions are due to gastrointestinal bleeding in patients with LVAD at 30 days [20]. Studies by Hasin et al. and Goldstein et al. also stated gastrointestinal bleeding as a leading cause of readmission in patients with LVAD [12, 21].
We further reviewed the resource utilization of readmitted patients and discovered that patients with a history of LVAD placement had an increased mean LOS (6.95 days vs. 4.78 days). We also noted high hospital charges and costs in patients with LVAD. Our results are similar to those of Lemor et al., who conducted a study on the National Readmission Database from 2010 to 2015. They reported 6 days as the mean LOS in patients with LVAD [22]. There is a scarcity of literature addressing pRBC, platelet transfusion, and parenteral nutrition while comparing these among NVUGIB patients with and without LVAD, but we did not observe any difference between the 2 groups.
Data from our study demonstrated no disparities in mortality among NVUGIB readmitted patients (1.51% vs. 4.49%, p = 0.36). We examined diverse variables acting as independent predictors of readmission in patients with LVAD and found that alcohol use disorder, discharge to home or skilled nursing facility, history of PCI, thrombocytopaenia, and bleeding during index hospitalization are associated with increased risk of 30-day readmission. In addition, Tsiouris et al. demonstrated that gastrointestinal haemorrhage in the periprocedural period of LVAD placement is independently associated with an increased readmission risk [23]. Patel et al. also studied NRD 2013 for LVAD procedure-related admissions [24]. They indicated that increasing age, Medicare insurance category, and discharge from a medium or large hospital in LVAD patients is associated with increased 30-day readmission. In the analysis of our study population (NVUGIB patients with LVAD history), we found that being discharged from a medium or large hospital is not associated with an increased readmission rate compared to a small hospital. Furthermore, we did not find any difference in the readmission rate based on age. In our analysis, we did not find a statistically significant association of teaching status of the hospital, having co-morbidities like atrial fibrillation, atrial flutter, valvular heart disease, protein caloric malnutrition, and sepsis during the index admission with an increased rate of readmission. Interestingly, we found that leaving against medical advice from the hospital is associated with decreased readmission instances. Similarly, living in a micropolitan area predicted lower readmission odds, possibly owing to reduced healthcare access.
Another study worth comparing with our analysis was conducted by Shah et al. on NRD from 2010–2014 [13]. They selected the patients with a history of congestive heart failure who had LVAD and compared it with CHF patients without LVAD, and calculated the 60-day readmission rate. They found that patients with LVAD have a higher rate of all-cause readmission (43.3%) as well as readmission with gastrointestinal bleeding (8.7%). Complications of the device followed by gastrointestinal bleeding were the most common readmission diagnoses in their study [9]. Conversely, we reviewed the most recent NRD from 2018. We investigated the 30-day readmission rate, and our inclusion criteria were NVUGIB as index admission compared to the study mentioned above, where the study population consisted of CHF patients. We also found that NVUGIB patients with LVAD had a higher readmission rate, but our study’s most common readmission diagnosis was gastrointestinal bleeding, accounting for 36.58% of readmissions. Shah et al. also investigated the 60-day readmission predictors and reported that gastrointestinal haemorrhage during index admission in addition to age, obesity, and alcohol use disorder were independently associated with increased odds of readmissions; similar results were seen in our study because bleeding during the index admission, alcohol use disorder, thrombocytopaenia, and discharge to home or skilled nursing facility was associated with increased readmission rate. Our analysis also accounted for the rate of procedures in readmitted patients and concluded that diagnostic and therapeutic endoscopy was needed more in patients with LVAD. Of the readmitted patients with NVUGIB who had LVAD, 37.50% required enteroscopy, whereas Shah et al. documented 43.6% of patients needing it. We also described that patients with LVAD have longer hospital stays and higher hospital costs; similar trends were noted in the study mentioned above. In summary, both of these studies are performed on NRD, but we investigated the 30-day readmission rate and identified additional readmission predictors compared to 60 days in this study. Our inclusion criteria were more specific with NVUGIB as index admission, compared to CHF as inclusion criteria by the study mentioned above.
There are various shortcomings to our study. First, the exposure is not completely randomized due to the retrospective nature of our study. We employed a Cox regression model to control for confounders, but residual confounding can still exist. Moreover, we controlled for the diverse patient and hospital-level characteristics, which minimizes the confounding risk even more. Second, an administrative database was used to acquire the data. Claims-based databases such as NIS are inherently vulnerable to erroneously entered data or diagnosis codes [25]. However, we used ICD-10-CM codes to extract data, which are more specific and granular than ICD-9-CM and have demonstrated high sensitivity and specificity to study gastrointestinal diseases [26, 27]. Third, data on medical treatments are not procured in the NIS; therefore, the use of medication putting patients at risk of gastrointestinal bleeding, including antiplatelet therapy and anticoagulants, could not be included and controlled for in the analyses [28]. Similarly, due to unavailable data on the laboratory values and race in the database, upper gastrointestinal bleeding-specific severity scales could not be used; instead, the Charlson Comorbidity Index, a generalized validated prognostic scale, was used, as was employed in previous studies [29]. Fourth, NRD cannot account for out-of-state readmissions because the same state data are recorded by default design. Consequently, those readmissions are missing in our analysis.
Regardless of these constraints, our study has numerous strengths. First, this study reports the direct comparative 30-day readmission rate of NVUGIB in patients with and without LVAD in a one-to-one fashion. Second, we used NRD, which includes data on patients at various hospital-level characteristics from 28 geographically dispersed states, as described in the Methods section. This results in better external validity and generalizability; hence, we believe that the results obtained should reflect the patient population admitted to the hospitals across the United States. Moreover, NRD eliminates the commonly encountered limitation of single-centre studies by allowing the use of a large sample size because it is the largest publicly available all-payer readmission database consisting of an inpatient population. This increases the power of the study reducing type II error in the analysis drawn. However, there is a potential risk of type I error, given that the alpha level is traditionally set at 0.05. In addition, utilizing nationally representative data, our study eliminates biases related to practice patterns in single- or multi-centre studies. Likewise, the distinctive variables in the database granted the opportunity to explore variables such as household income estimates, hospitalization cost, and hospital factors, which are not generally possible in single-centre studies [30]. Finally, to achieve a lower readmission rate, risk factors for 30-day readmission are identified in our study, a potential arena for focused interventions within the LVAD population. Even if unalterable, these elements can identify high-risk patients and guide future discharge strategies to prevent and decrease readmission.
Conclusions
Non-variceal upper gastrointestinal bleeding patients with LVAD have a higher 30-day readmission rate than patients without LVAD. In both groups, gastrointestinal bleeding is the most common cause of readmission, whereas patients with LVAD require more complex haemostatic endoscopic interventions. Although there are no differences in mortality and morbidity, readmitted patients in the LVAD group result in increased hospital resource utilization. In addition, we identified independent predictors of readmission in the LVAD group, and knowing these factors is essential for reducing the number of readmissions and the associated costs.


