


Introduction
Diabetes mellitus (DM) is an autoimmune disease characterized by hyperglycaemia accompanied by disturbance in the metabolism of carbohydrates, proteins, and lipids [1]. It was predicted that the prevalence of diabetes would increase worldwide from 177 million in 2000 to 370 million in 2030 [2]. In Egypt, the prevalence of type 1 DM (T1D) among school children in Cairo is 1.09/1000 [3].
In humans, diabetes mellitus is one of the most prevalent conditions with spontaneous manifestations [4]. In animals, T1D can be induced by the administration of diabetogenic inducing drugs such as streptozotocin, alloxan, and anti-insulin serum. These agents selectively destroy the Langerhans islet β-cells [5]. The initiation of T1D requires both CD4+T cells that are insulin reactive and CD8+ T cells that play a major role as β-cell killers [6]. In addition, B cells, natural killer (NK) cells, natural killer T cells (NKT), γδT, and macrophages participate in T1D disease progression [7].
NK cells play an important role in direct killing of target cells that are transformed or infected by certain microorganisms [8]. The natural cytotoxicity receptors include NKp46, NKp30, and NKp44, which are expressed on NK cells [9]. NK cells appear in the pancreas when insulitis progresses to T1D, and NKp46 engagement by β cells leads to degranulation of NK cells [10]. Injection of soluble NKp46 proteins into non-obese diabetic mice during the early phase of insulitis and the pre-diabetic stage prevent the development of T1D [11]. These findings demonstrate that NKp46 plays an important role in T1D and highlights potential new therapeutic modalities for this disease.
Regulatory T cells (Tregs) were first described as suppressors of antigen-activated immune responses to self- and non-self-antigens [12]. Several markers for Tregs, such as human transcription factor forkhead box P3 (FOXP3), CTLA-4, CD25, and CD127, have been implicated [13]. FOXP3 could be essential for the development and the maintenance of their suppressive function [14]. Mutations and disruptions of the FOXP3 regulatory pathway lead to organ-specific autoimmune diseases such as T1D [15].
Interleukin 2 (IL-2) is mainly secreted by activated T cells and, to a lesser extent, by activated dendritic cells, natural killer (NK) cells, NKT cells, and B cells [16]. NK cells and T cells constitutively express receptors (CD122 and CD132), by which they respond to high-dose IL-2 and are activated [17]. Tregs constitutively express the high-affinity receptor for IL-2 (CD25), while this expression on other subsets of T cells is induced merely after activation. Therefore, in the steady state, Tregs respond better to IL-2 than other T cells [18]. This is why low-dose IL-2, hypothetically, preferentially increases Treg numbers without causing overall immune activation [19]. In fact, Treg activation has been linked to IL-2 administration in mice, and a short course of low-dose IL-2 administration can reverse established disease [20].
Malek et al. (2015) reported that Tregs from normal individuals were invariably better responders to IL-2, followed by NK cells and memory T cells. Further work is needed to determine the heterogeneity of responsiveness to low-dose IL-2 in Tregs as well as other IL-2–responsive cells, especially NK cells [21].
Chitosan is a polymer that is either partially or fully deacetylated chitin. It has been investigated extensively as a potential drug carrier due to its biocompatible characteristics. Therefore, it has been used widely in the medical field [22]. Studies recommended its use to coat other material nanoparticles to increase their bioavailability and decrease their impact on the body [23].
Aim
We intended in the present work to evaluate the modulatory effect of low-dose IL-2-loaded chitosan nanosphere on NKp46-expressing natural killer cells, and to compare this to its effect on FOXP3-expressing T regulatory cells in diabetic male inbreed BALB/c mice.
Material and methods
Experimental animals
A total of 116 BALB/c mice (10–12 weeks old and 20–25 g weight), were housed in polycarbonate cages inside a well-ventilated room. Each cage contained not more than 5 mice. They were maintained under standard laboratory conditions of temperature (22ºC) with light/ dark cycles of 12 h each, and the mice had free access to water and a pellet diet. The streptozotocin (STZ)-induced diabetic mice fasted overnight before the start of the experiment [24]. All procedures were performed in accordance with regulations of the Medical Research Institute guide for the care and use of laboratory animals, and after the acceptance of the Ethical Committee of Alexandria University. Mice were purchased from the animal house of the Medical Technology Centre in the Medical Research Institute, Alexandria University. The study was conducted from January to August 2018.
The mice were divided into 5 groups:
group I: included 51 mice induced for T1D, injected with murine recombinant IL-2 loaded into chitosan nanoparticles,
group II: included 21 mice induced for T1D, injected with murine recombinant IL-2,
group III: included 20 mice induced for T1D, injected with empty chitosan particles,
group IV: included11 mice induced for T1D not injected with any formulation, as the first control group. (control 1: diabetic mice),
group V: included 8 mice free from T1D as a second control group. (control 2: non-diabetic mice).
Type 1 diabetes mellitus induction protocol
T1D was experimentally induced according to the protocol described by Brosius (2003) [25]. Filtered sterilized cold citrate buffer was added to streptozotocin (STZ) 9200 µl/mg (STZ, SIGMA, Germany) to a concentration of 5 mg/ml. Citrate buffer (0.1 M): 2 parts of sodium citrate (0.1 M) and 3 parts of citrate acid (0.1 M), adjusted to pH 4.0 by using NaOH (1 N). Intraperitoneal injection of streptozotocin 200 mg/kg body weight (bw) was used, divided into 5 consecutive daily doses of 40 mg/kg bw each. Negative control mice received freshly prepared sodium citrate buffer by the same route.
Blood from the retro-orbital sinus of all mice was collected for assessment of glucose and insulin levels. The blood glucose level was measured by a glucometer (mg/dl) while insulin level (pmol/l) was measured by enzyme-linked immunosorbent assay (ELISA).
Preparation of IL-2-loaded chitosan nanoparticles
Low-molecular-weight chitosan (48 kDa) derived from shrimp shells (Pandalus borealis) was purchased from Primex Co., Iceland. Interleukin-2 was provided in the form of 200 µg/ml liquid, purchased from BioLegend, Netherlands. Chitosan nanoparticles (CSNPs) free or loaded with IL-2 were prepared by ionic gelation method. One mg/ml of low-molecular chitosan was dissolved in 1% (w/v) acetic acid and sonicated until the solution become transparent. Triphenyl phosphate (TPP) solution (1 mg/ml) was added drop wise to CS solution (pH = 5), under continuous stirring at 600 rotations per minute (rpm) for 30 min at room temperature. CSNPs spontaneously form via the electrostatic attraction between positively charged primary amino groups on chitosan chains and reversely charged polyanions (from TPP).
Recombinant murine IL-2-loaded chitosan nanoparticles were prepared according to Bertohold et al. [26] Recombinant IL-2 with different concentrations (0.05–0.1 and 0.33 µIU) were added to sodium sulphate solution (20% w/v). Sodium sulphate solution containing murine recombinant IL-2 was dropped into the acidic chitosan solution and stirred at 500 rpm for 1 h. The resulting opalescent suspension was determined as IL-2-loaded chitosan nanoparticles. Reaction mixture was centrifuged at 15,000 rpm at 4ºC for 15 min. The supernatant was decanted, and nanoparticles were suspended in sterile distilled water and centrifuged at 15,000 rpm at 4ºC for 15 min to separate the nanoparticles in centrifuge.
IL-2 encapsulation efficiency of chitosan NP was determined by measuring the difference between the amount of protein incorporated in the nanoparticle preparation medium and the amount of non-entrapped protein remaining in the aqueous medium after the encapsulation process. Protein content in the supernatant was spectrophotometrically determined by universal protein content assay. Characterization of nanospheres was done using a scanning electron microscope [27] (Figure 1), furious transmission Infra-Red (Figure 2) [28], and Zetasizer [29]. IL-2 loading and encapsulation efficacy of the nanoparticles was around 97%.
Figure 1
Scanning electron microscope images showing CSNPs in the upper part of the figure with spherical porous morphology with average diameter of 91.835 nm. Lower part of the figure shows images for CSNPs loaded with IL-2 (spherical porous morphology with average diameter of 276.3175 nm)
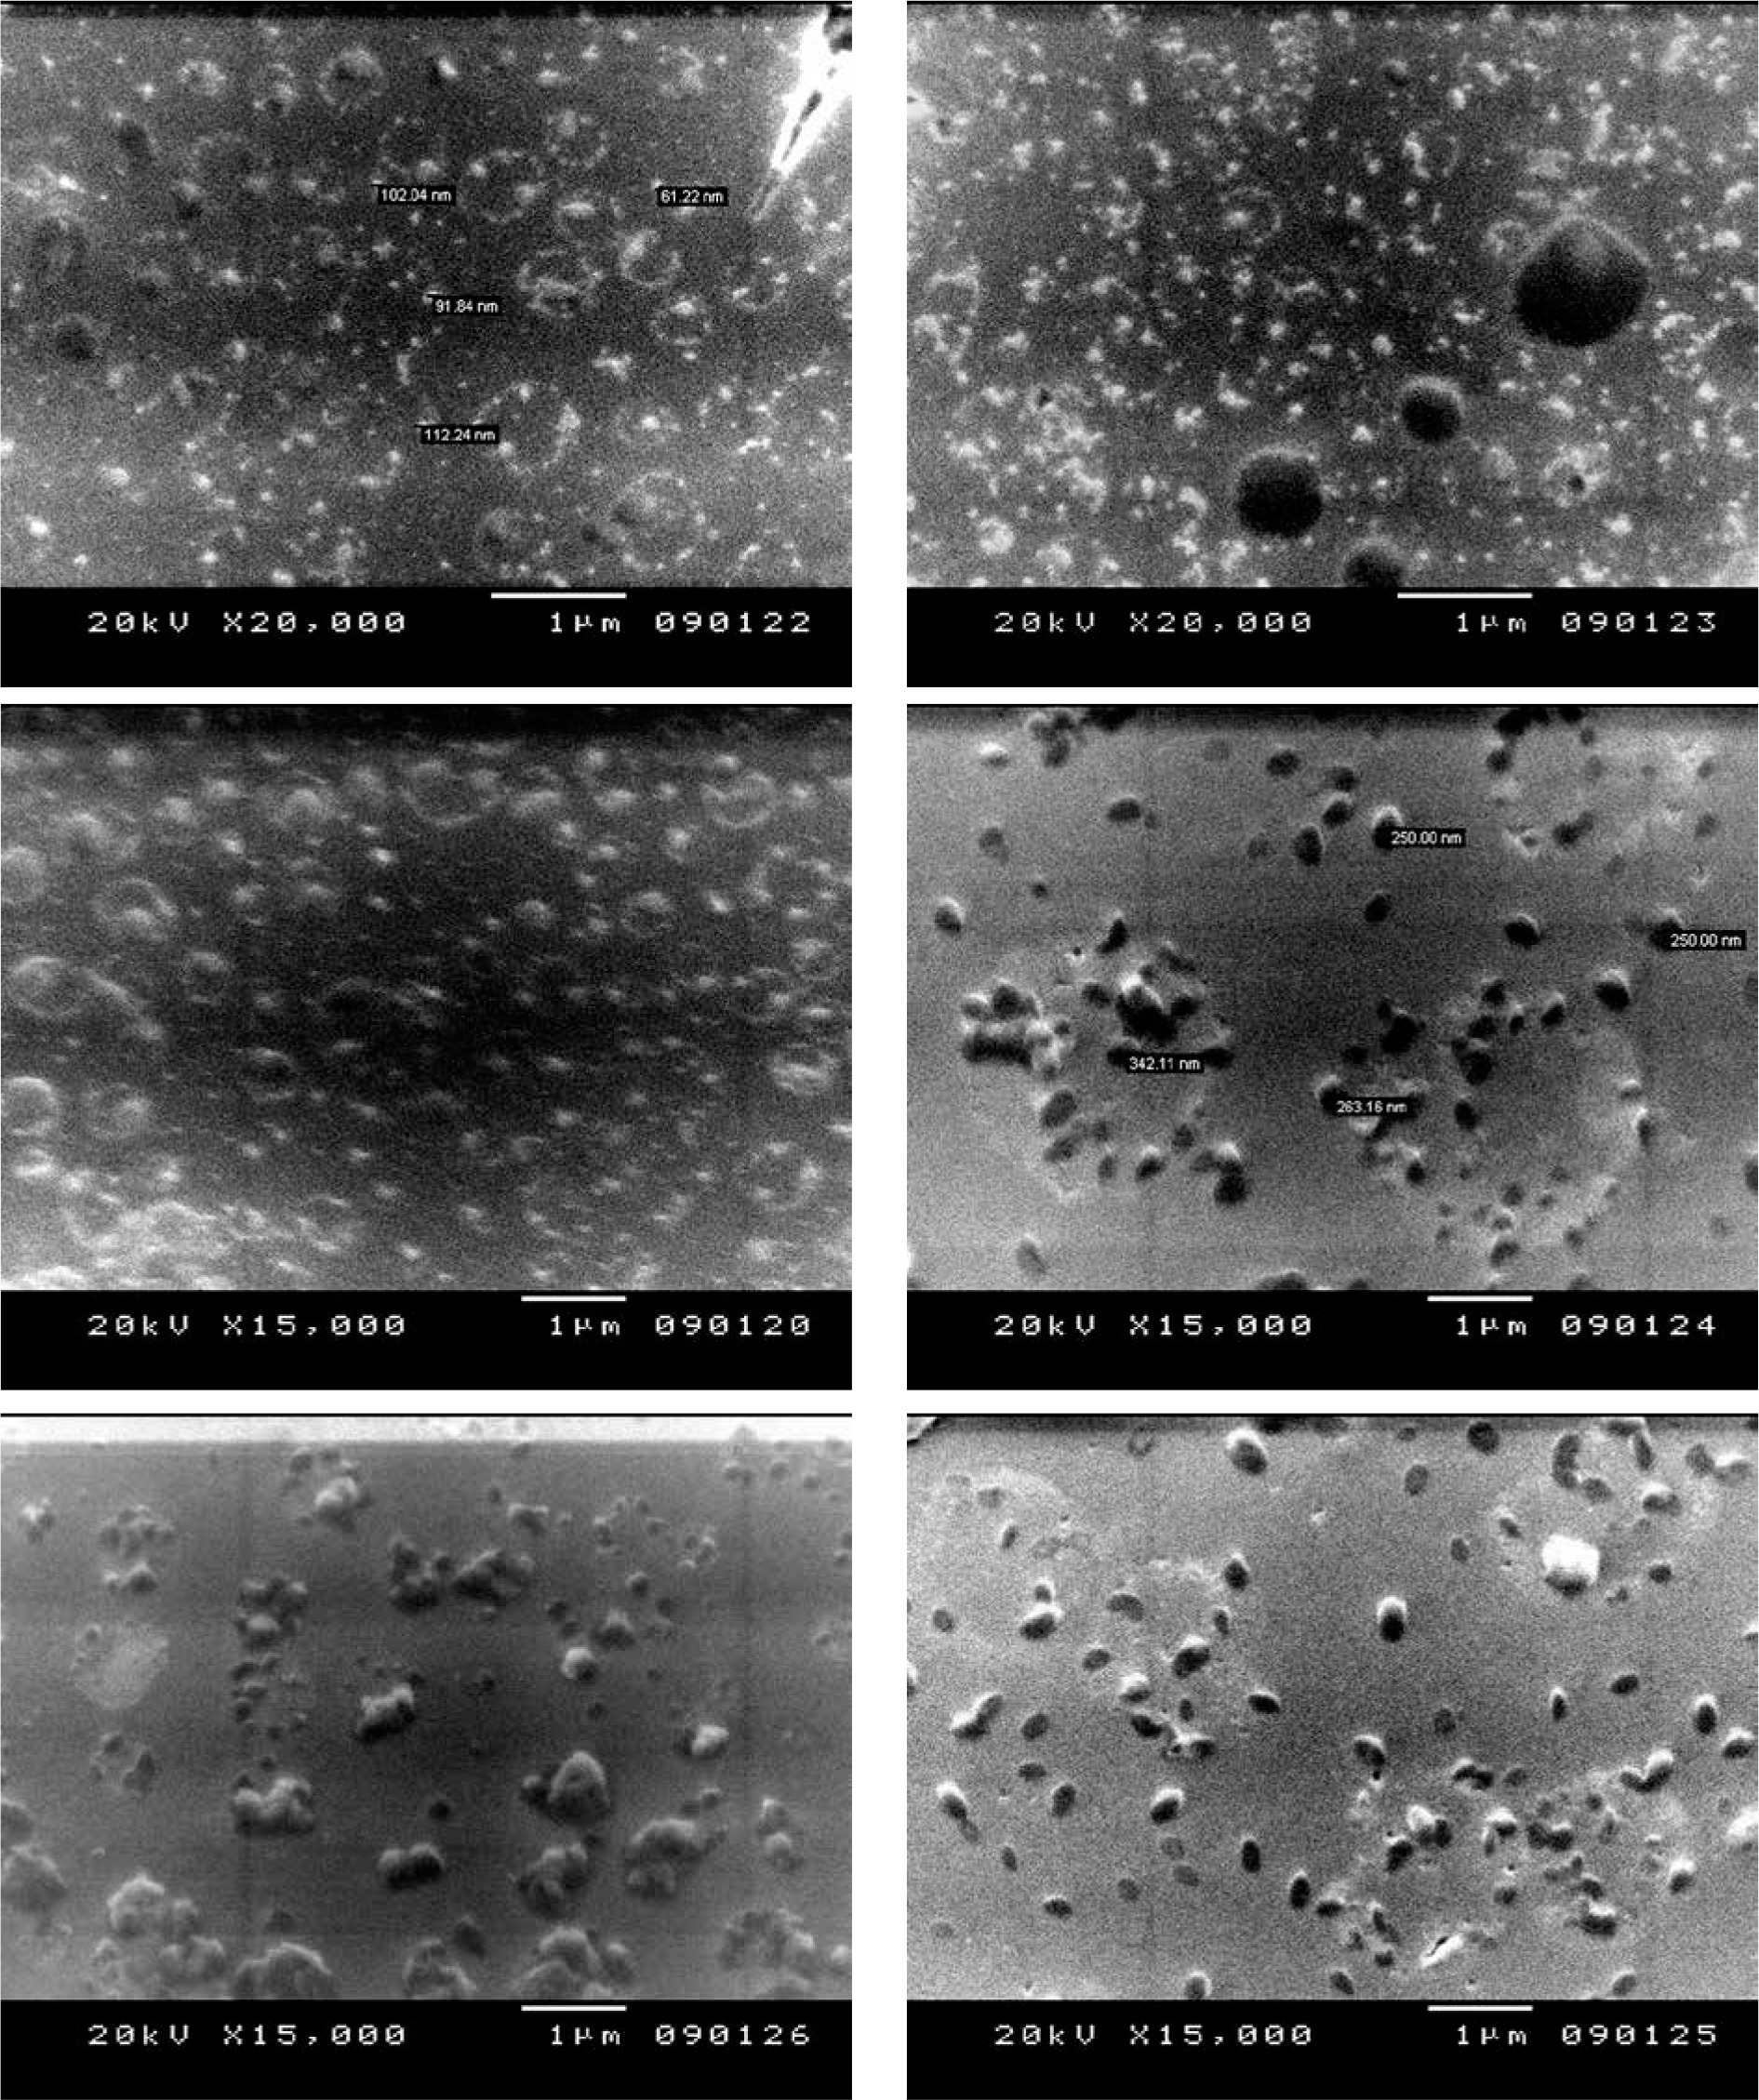
Figure 2
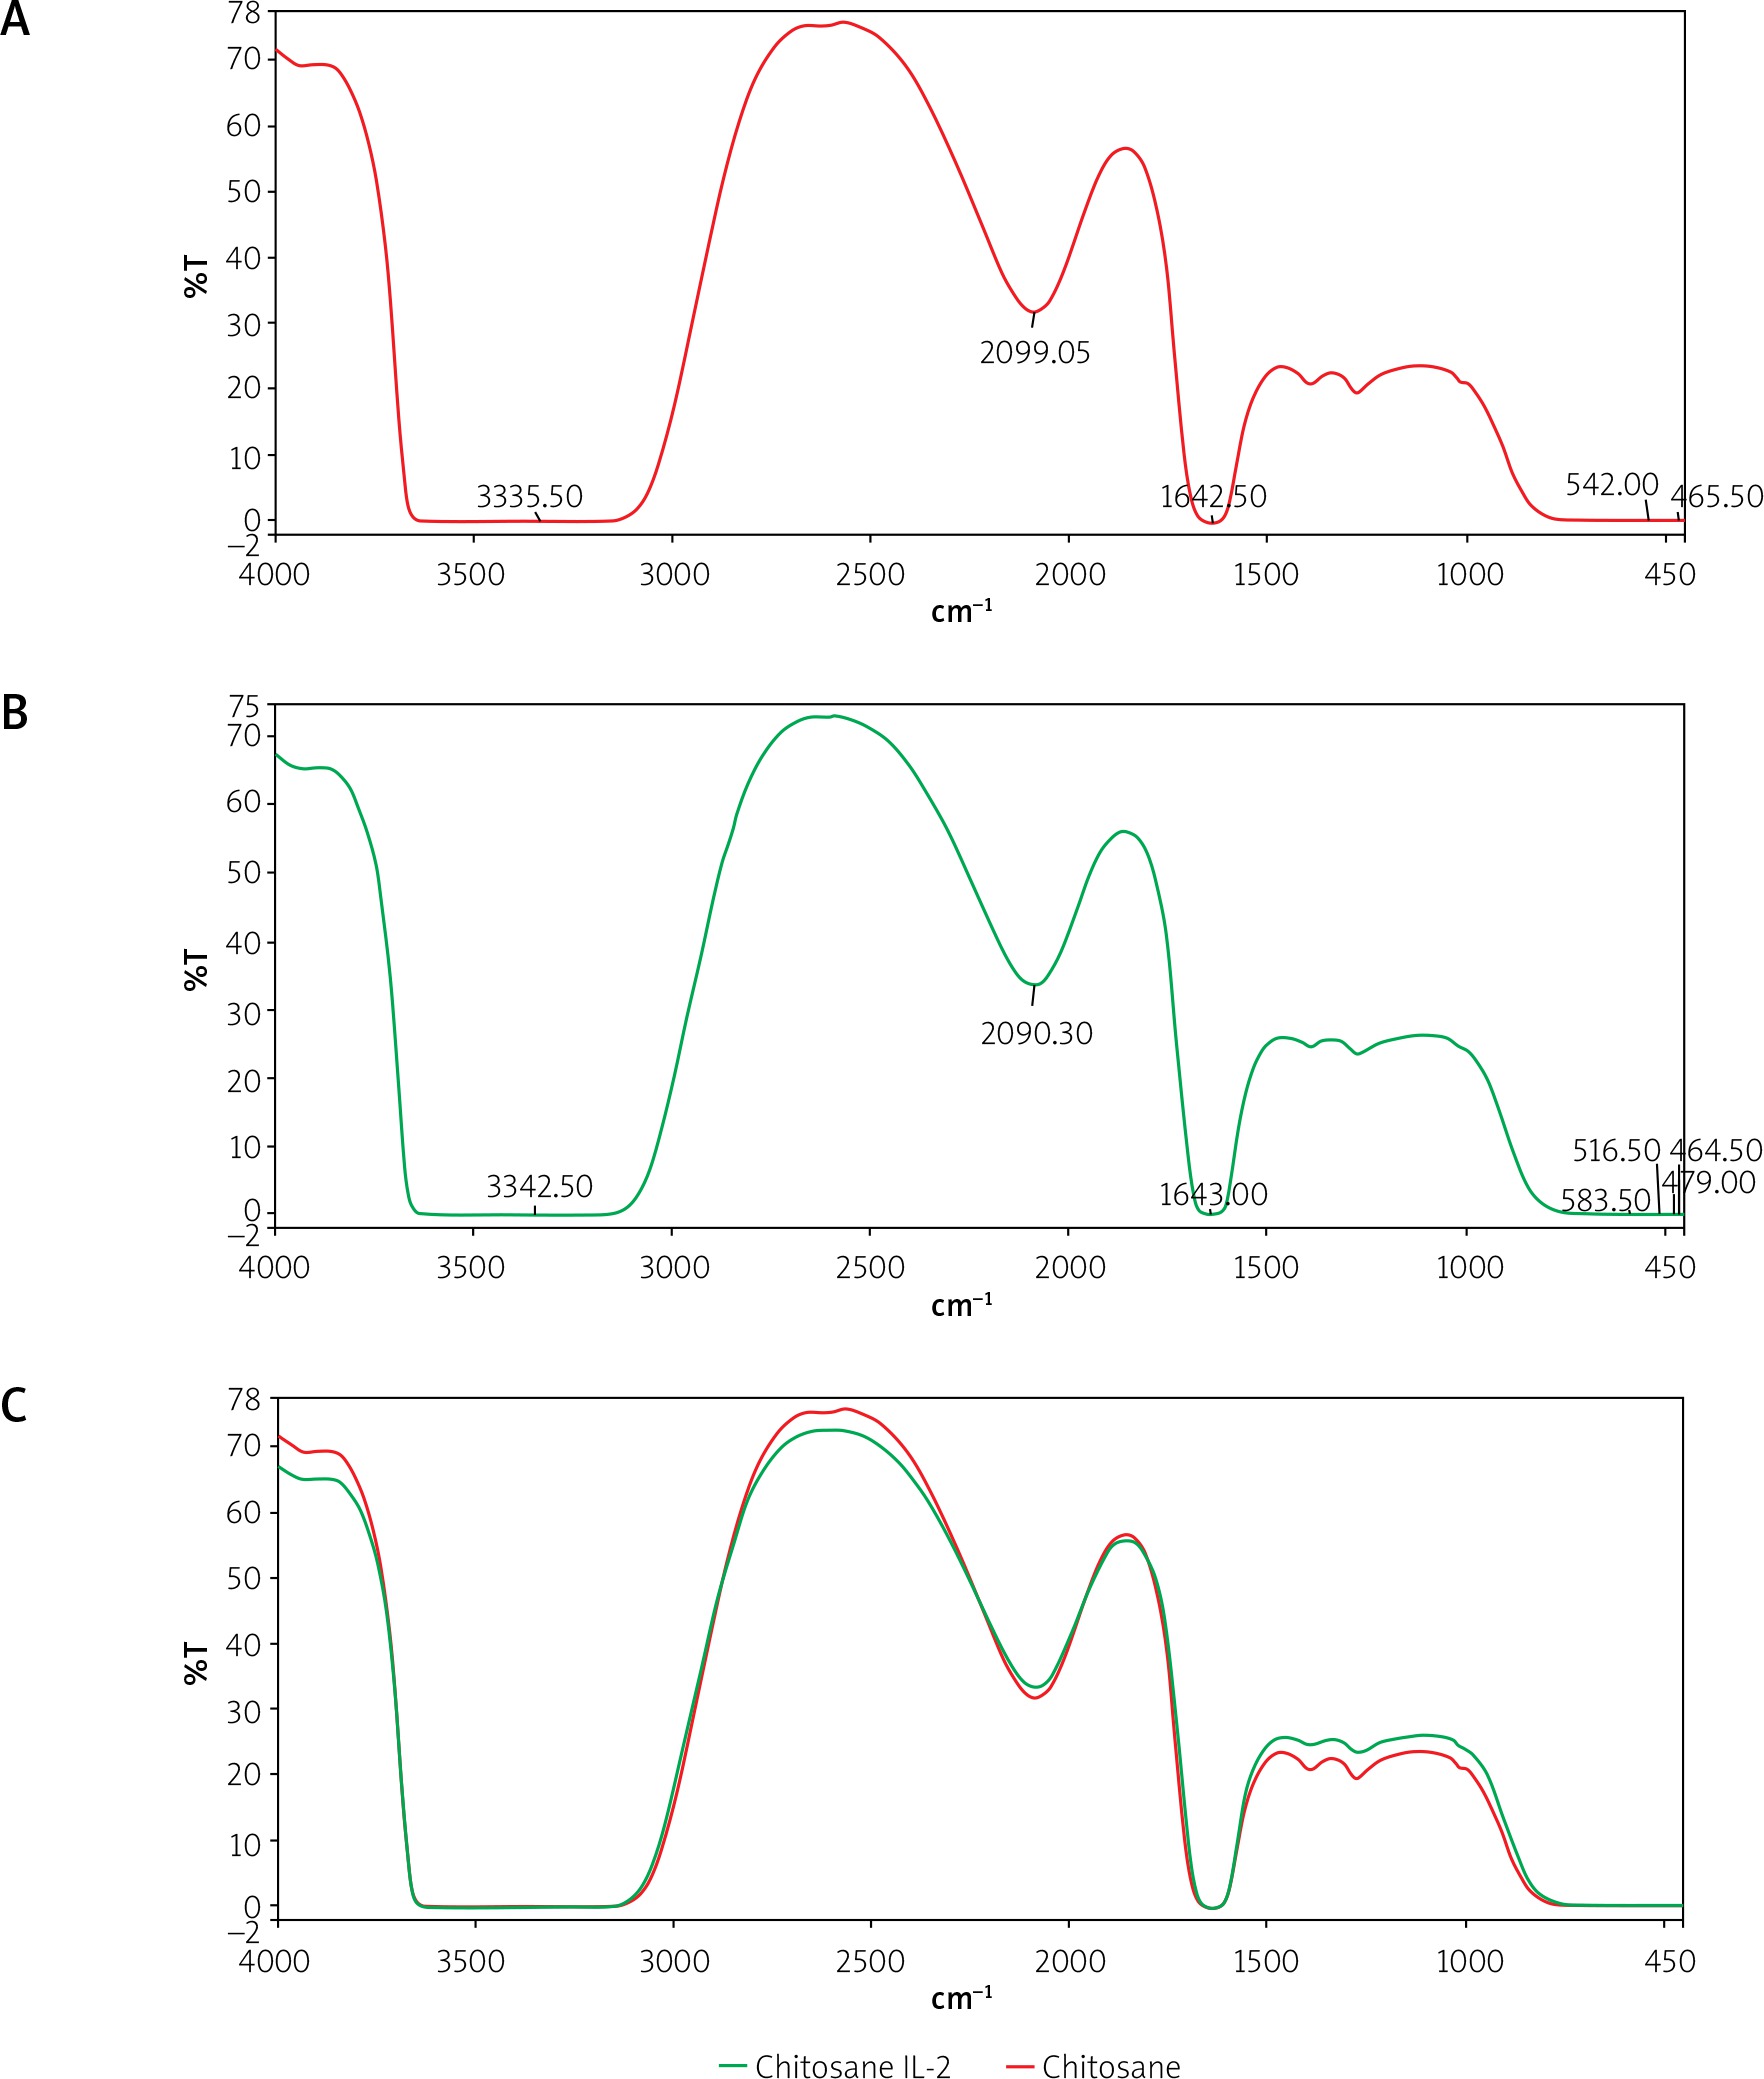
FT-IR spectrum of chitosan using FT-IR spectroscopy (Shimadzu, FT-IR-8400S, Japan). A – The stretching vibration of OH and NH2 groups is centred at 3335.60 cm–1 for CSNPs, the peaks at 2089.05 cm–1 with C-H stretching vibration for CSNPs, C=O vibration appears at 1642.50 cm-1 of the acetyl groups in chitosan. The peaks around 542 cm–1 correspond to saccharide structure of chitosan. B – The stretching vibration of OH and NH2 groups is centred at 3342.5 cm–1 (steady state) for CSNPs loaded with IL-2, the peaks at 2090.30 cm–1 with C-H stretching vibration for CSNPs loaded with IL-2, C=O vibration appears at 1643 cm–1 in CSNPs loaded with IL-2. The peaks around 5 583.50 cm–1 for CSNPs loaded with IL-2. C – The 2 curves are almost identical, indicating no change in characters between CSNPs and CSNPs loaded with IL-2
IL-2-loaded chitosan injection protocol
Following STZ injection (40, 45, or 50 mg/kg/day), IL-2 loaded onto chitosan was prepared with actual doses of 0.05, 0.1, and 0.3 µIU divided into 5 consecutive days administrated by subcutaneous injection according to the protocol of klatzmann Abbas [30]. Mice were sacrificed at day 7, 14, and 21 following IL-2/chitosan administration (Table I).
Morphological and immunohistochemical methods and morphometric analyses
For each of the above mice, the body and tail (splenic lobe) of the pancreas was obtained through a midline abdominal incision and placed in cold 10% formalin containing phosphate-buffered saline for at least 24 h. Pancreata were stored in 70% alcohol for several days. Following dehydration in graded concentrations of alcohol and xylene, the blocks of tissue were oriented along their long axes parallel to the bottom surface of the embedding mould and embedded in Paraplast. Orientation of the specimens in this manner allowed for histological sections to consist of continuous body and tail segments of pancreas. The embedding method also allowed for maximization of the number of sections containing enough pancreatic islets for histological and immune histochemical study. Serial sections were cut at 5 µm intervals. For each pancreatic sample, 3 separate serial sections (500 µm intervals apart) were stained with haematoxylin-eosin (H&E) and examined morphologically. The total number of islets/sections was determined manually by microscopic inspection of each pancreatic section.
Short-term culture
Spleens were removed and collected into Petri dishes (7.5 × 1.5 cm; Biosystem S.A., Spain), washed with 1 ml phosphate buffer saline (PBS) (pH = 7.2), then squeezed. PBS was added to cells and centrifuged at 2000 rpm for 3 min. The cell pellet was resuspended, counted, and adjusted to 1 × 10⁶/ml in 4 ml complete tissue culture medium composed of RPMI-1640 supplemented with L-glutamine, 10% heat-inactivated foetal calf serum, penicillin (100 IU/ml), and streptomycin (100 µg/ml). Splenocytes were maintained in a short-term culture (48 h) stimulated with 10 µl of concavalin A (Con A) (plant mitogen, known for its ability to stimulate mouse T-cell subsets) (Dwyer et al., 1981). Details of the tissue culture protocol were adopted from the standard method developed by Davis (1995) [31].
NK and Treg cell expression
Assessment of NK and Treg cells was done using both flow cytometry (Cytomics FC500 flow cytometer) and ELISA. Monoclonal antibodies (mab) were purchased from (eBioscience, San Diego, CA), anti-CD3-FITC, anti-CD4-PE and anti-CD25-FITC, or anti-CD56-PE. The frequency of each cell subset was calculated based on the percentage of positive cells in the total lymphocyte gate. For intracellular staining, cells were first labelled with relative marker, fixed, and permeabilized using a fix/perm kit according to the manufacturer’s instructions and then labelled with anti-FOXP3-PE or anti-NKp46-PE mab (PCH101; eBioscience).
NKp46 and FOXP3 were measured also in cell lysate by sandwich ELISA for in vitro quantitative measurement (mybiosource.com/prods/ELISA-Kit/mouse/forkhead-box-P3, NKp46). Following cell culture of mouse spleen cells, repeated freezing and thawing cycles were done to damage the cells and release the inside components of the cell, followed by centrifugation at 2000–3000 RPM for approximately 20 min. The supernatants were collected carefully and centrifuged again when sedimentation occurred during storage.
In vitro suppressor assay
YAC-1 responder cells (ATCC® TIB160™) acquired from the Medical Technology Centre in Alexandria University were co-cultured with isolated NK cells in the absence or presence of Treg (CD4+CD25+) cells to study the suppressive activity of Tregs. One million responder cells were labelled by incubating cells with 100 mCi 51Cr for 90 min at 37°C, washing them 3 times with PBS, and seeding them at 104 cells/well in round-bottom 96-well plates. The previously isolated NK cells were added to each well and cultured together at a ratio of 1 : 0.5, respectively, in RPMI-1640 complete culture medium. After 4-h incubation, 100 ml volumes of supernatant were collected and the amount of 51Cr released was measured using a g-counter. NK cells were harvested and assessed for IFN-γ production by ELISA and the percentage of responder cell killing. IFN-γ levels were estimated using commercial ELISA (Quantikine R&D system, ELISA kit, USA) according to the manufacturer’s recommendation [32].
Statistical analysis
All analyses were performed using SPSS software (SPSS for Windows, version 21.0, Chicago, IL, USA) [33]. The test of normality was done using the D’Agstino test. Quantitative data were described using mean and standard deviation for normally distributed data, while abnormally distributed data were expressed using median, minimum, and maximum. For normally distributed data, comparison between populations was done using t-test and (ANOVA) Pearson correlation coefficient. For abnormally distributed data, Mann-Whitney Test and Spearman correlation were used. P-values less than 0.05 or 0.01 indicated statistical significance.
Results
Animal grouping and characteristics
An independent biostatistician (Graphpad Software) was used to calculate sample sizes. The analyses were predetermined (protocol-specific). The present study included 107 (93%) mice used as a model for experimental T1D, and 8 (7%) mice as negative controls. One week after diabetes induction, 15 diabetic mice were left without any treatment and represented the positive control group. Another 20 (17%) diabetic mice were treated with empty chitosan nanoparticles, and 21 (18%) were treated with free IL-2 at concentrations of 0.05, 0.1, and 0.3 uIU/ml. Another 51 (44%) diabetic mice were treated with the same concentrations of murine recombinant IL-2 loaded into chitosan nanoparticles. At weekly intervals after IL-2 treatment, mice from all the groups under study were sacrificed.
Blood glucose level was monitored once before and daily after STZ injection until a diabetic status was confirmed. Insulin levels were also measured and used in parallel with animal weight to monitor the diabetic status of mice (data not shown).
Histopathological studies
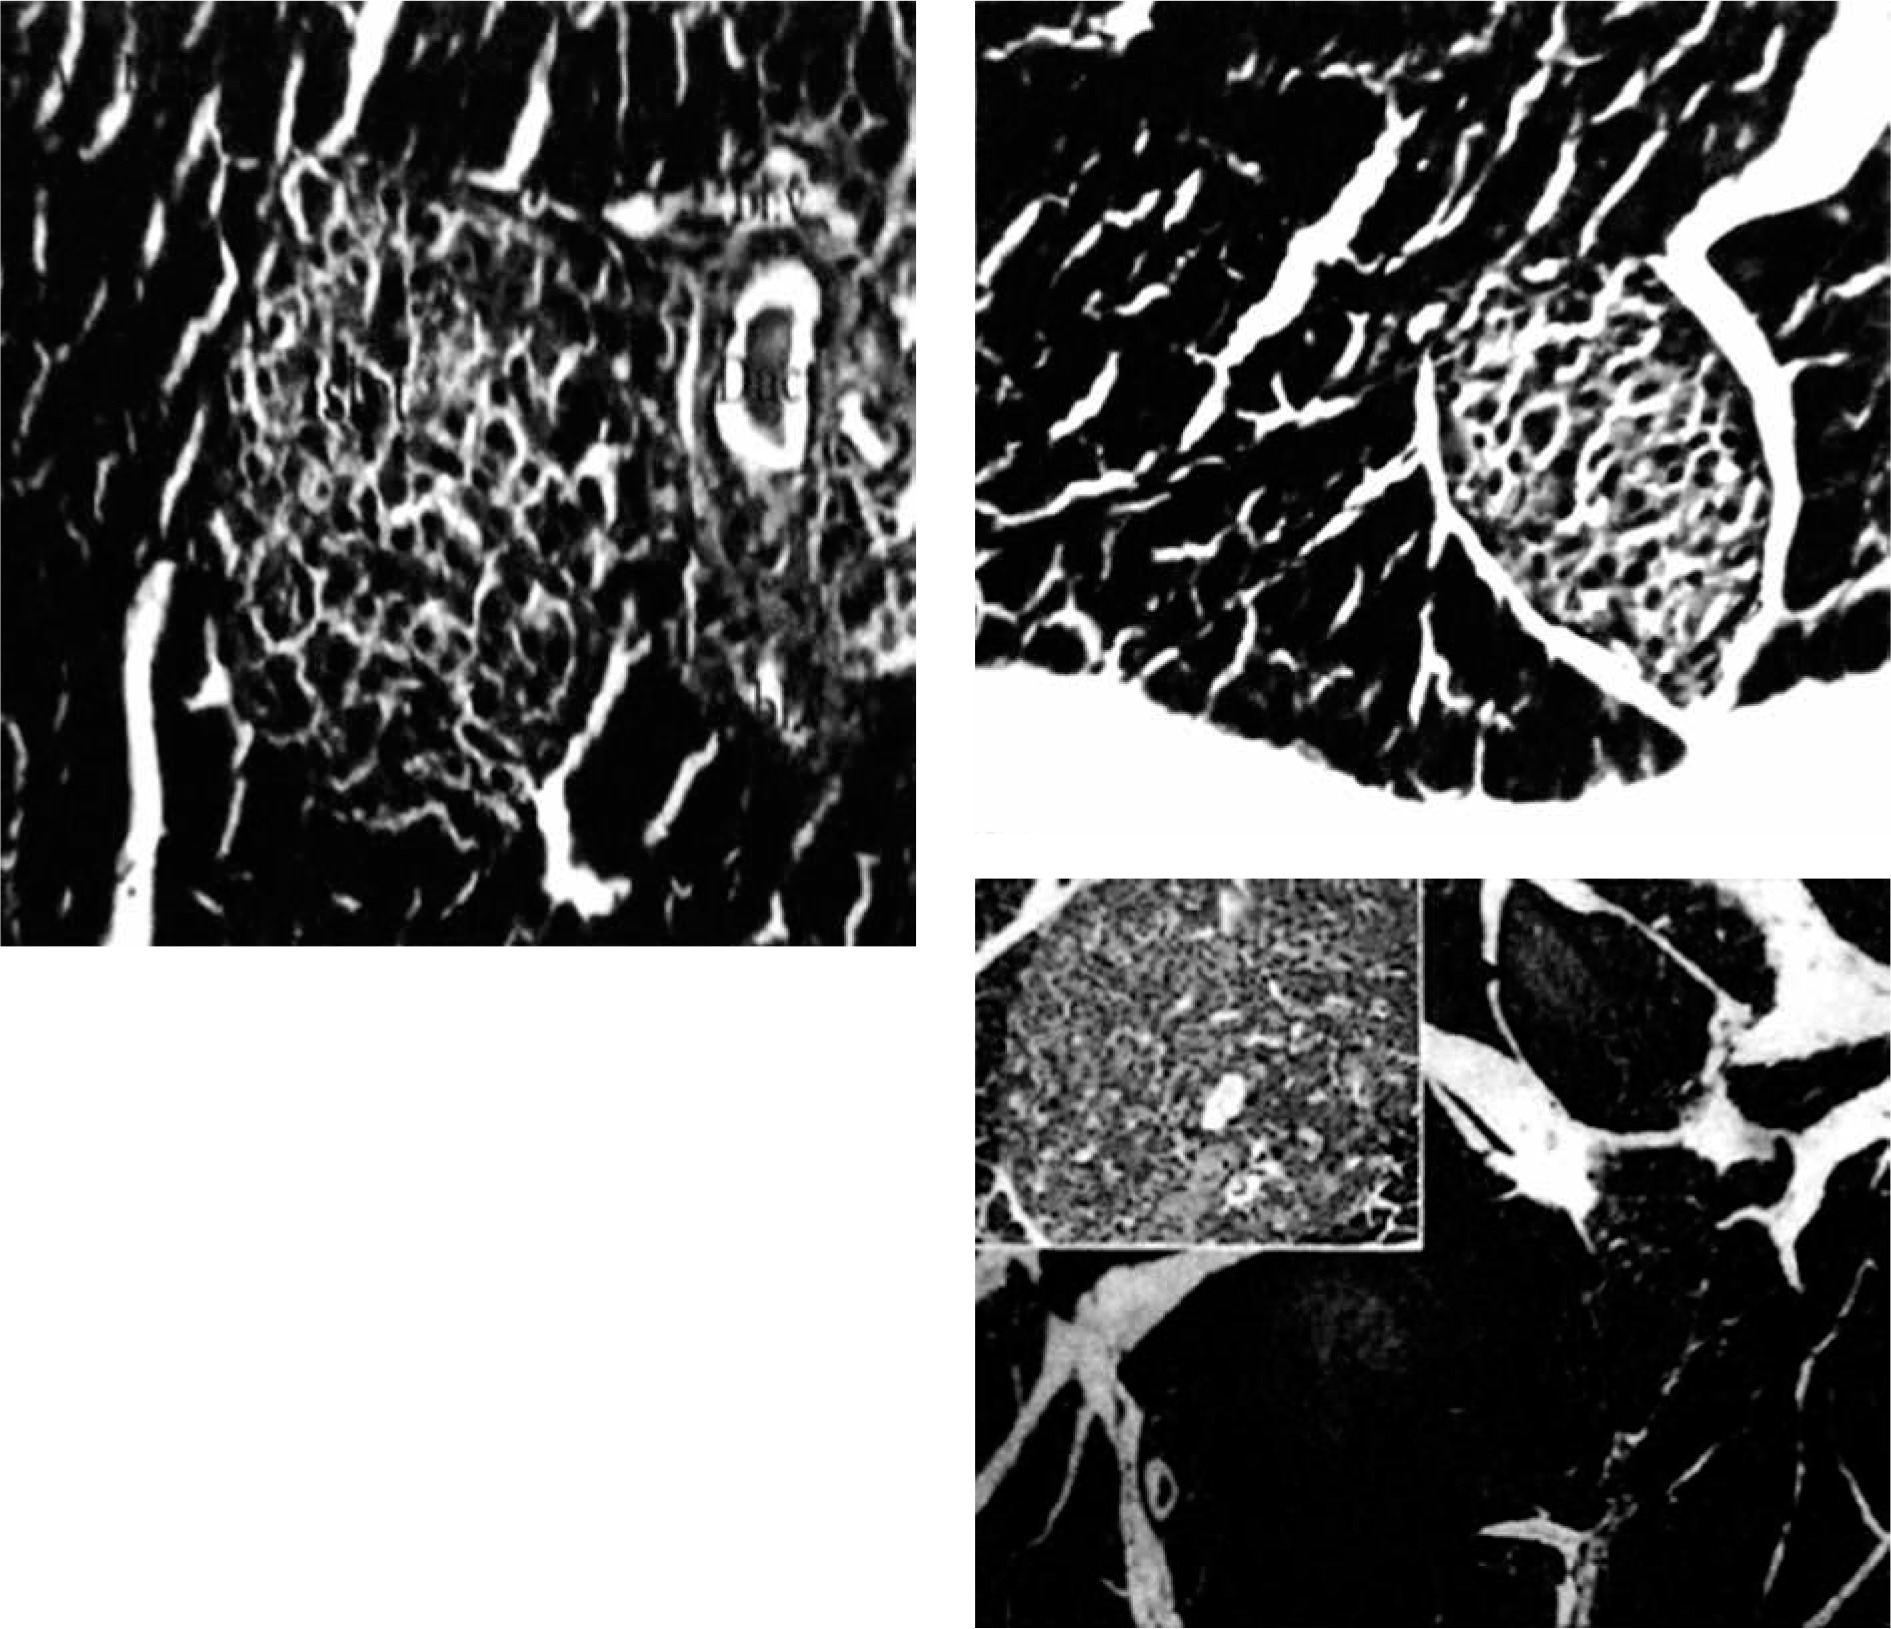
Immediately after each scarification of mice at various time intervals following induction of T1 DM, the pancreatic organs were isolated and subjected to a detailed histopathological examination to monitor changes characteristic for T1 DM. These include degenerative changes, apoptosis, hyperplasia, and inflammatory cell infiltrates. Our results are in agreement with Masson et al. (2009), who showed that STZ led to distortion of normal islets, but they differ from Bulter (2007), who did not detect β cell replication in the pancreatic section of type 1 diabetes (Figures 3, 4).
The effect of different formulations on the expression of NK cells and NKp46
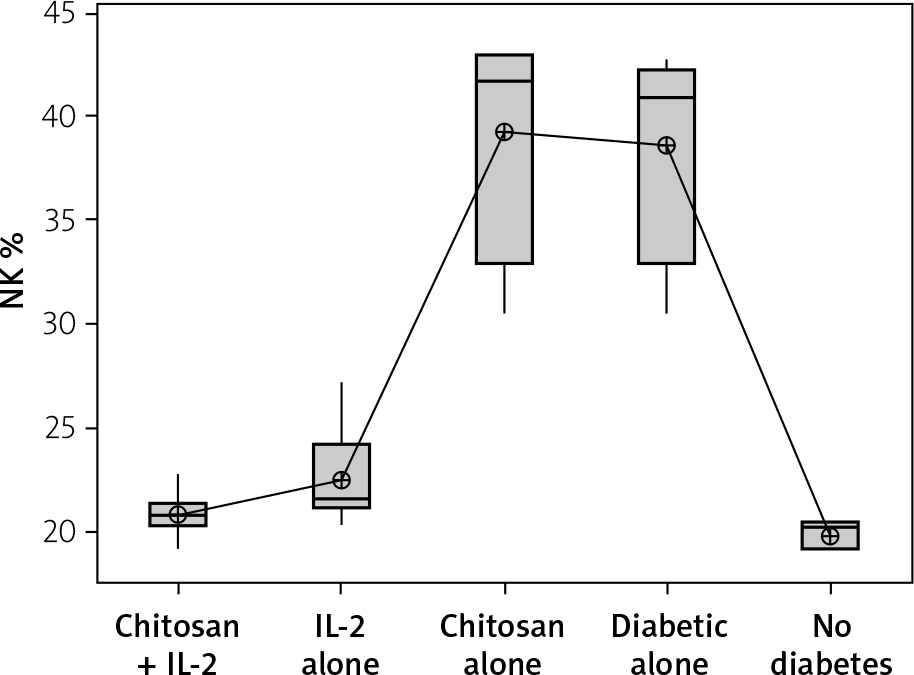
NK cells show significant changes in number in different animal groups (Figure 5). We noticed that mice induced for T1D had higher numbers of NKp46+ NK cells (mean ± SD: 38.7 ±5.66%) with no significant difference compared to mice injected with empty chitosan nanoparticles (39.20 ±6.02%) (p = 0.999). A significant decrease in NK expression was seen in mice injected with low-dose IL-2 (22.43 ±2.47%) or low dose IL-2 loaded in chitosan nanoparticles (22.43 ±2.47%) with no statistical difference between the latter and the non-diabetic group (19.823 ±0.652%) (p = 0.988).
Figure 5
NK cell expression in different groups. Data showed as percentage of expression by FACS (Group I: chitosan + IL-2 represented by 51 diabetic mice treated with chitosan + IL-2 (0.3) µIU, Group II represented by 21 diabetic mice treated with IL-2 alone (0.3) µIU, Group III represented by 20 diabetic mice treated with chitosan alone (empty Chitosan), Group IV represented by 11 diabetic mice, and Group V represented by 8 non-diabetic mice)
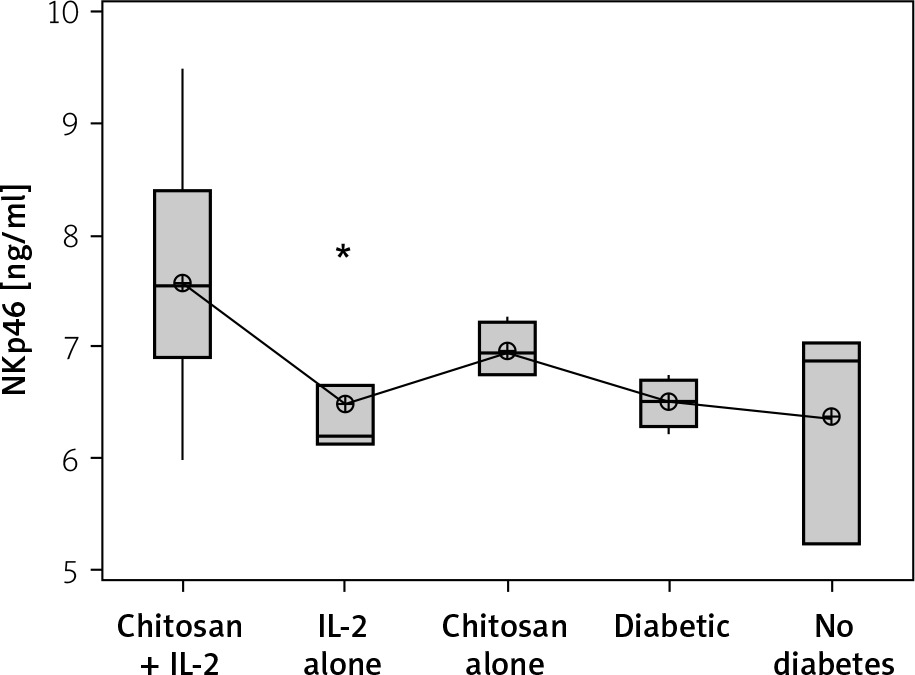
On the other hand, a significant increase in cell lysate NKp46 expression was seen in mice injected with IL-2-loaded chitosan compared with the other groups. However, a significant NKp46 expression reduction was noticed in mice injected with low-dose IL-2 alone (p = 0.01) (Figure 6).
Figure 6
NKp46 in cell lysate in different groups. Data showed as (ng/mL) by ELISA (Group I: chitosan + IL-2 represented by 51 diabetic mice treated with chitosan + IL-2 (0.3) µIU, Group II represented by 21 diabetic mice treated with IL-2 alone (0.3) µIU, Group III represented by 20 (0.3) µIU, Group II represented by 21 diabetic mice treated with IL-2 alone (0.3) µIU, Group III represented by 20 diabetic mice treated with Chitosan alone (empty Chitosan), Group IV represented by 11 diabetic mice, and Group V represented by 8 non-diabetic mice
The effect of changes of doses of IL-2-loaded chitosan on NK cell and NKp46 expression
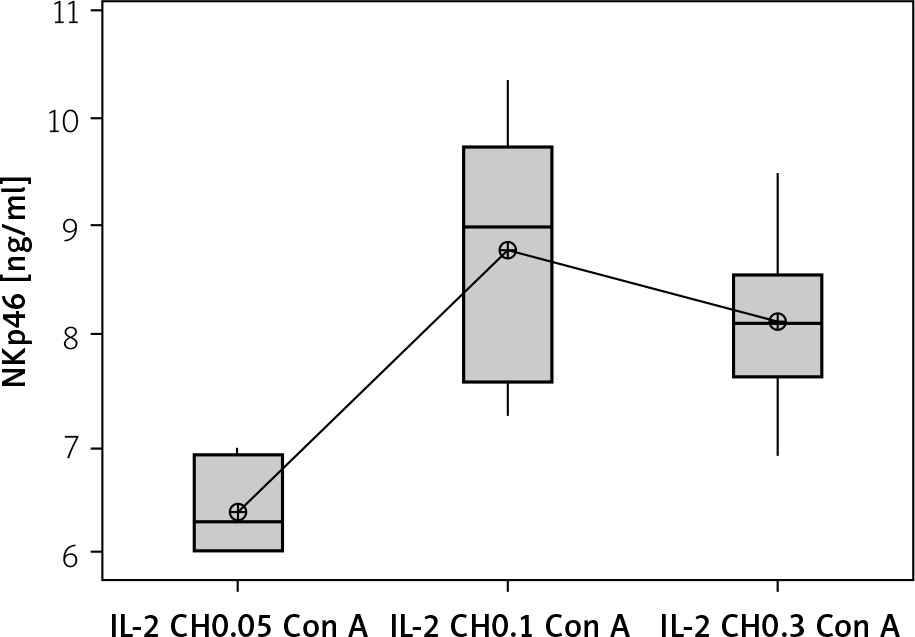
We used 3 different doses of IL-2-loaded chitosan injections (0.05, 0.1, and 0.3 µIU). A highly statistical reduction in NK cell expression was noticed in mice injected with 0.3 µIU (p < 0.001). A non-significant difference was shown between the 2 other doses (p = 0.901) (Figure 7). For NKp46 expression in cell lysate, a statistical elevation was noticed in mice injected with 0.1 µIU, and a significant reduction was seen in mice injected with 0.05 µIU (Figure 8).
Figure 7
Effect of changes of doses of IL-2+chitosan on NK cell expression. Data shown as percentage of expression by FACS (Group I: chitosan + IL-2 (0.05) µIU) represented by 17 diabetic mice treated with chitosan + IL-2 (0.05) µIU, Group II represented by 17 diabetic mice treated with chitosan + IL-2 (0.1) µIU, and Group III represented by 17 diabetic mice treated with chitosan + IL-2 (0.3) µIU
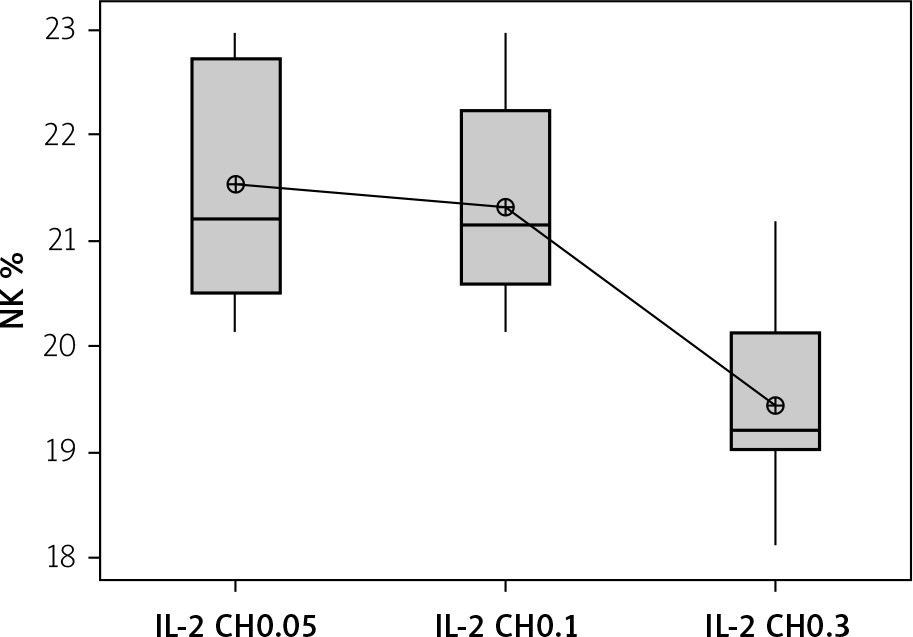
Figure 8
Effect of changes of doses of IL-2 + chitosan on NKp46 in cell lysate in different groups. Data showed as (ng/ml) by ELISA. (Group I: chitosan + IL-2 (0.05) µIU) represented by 17 diabetic mice treated with chitosan + IL-2 (0.05) µIU, Group II represented by 17 diabetic mice treated with chitosan + IL-2 (0.1) µIU, and Group III represented by 17 diabetic mice treated with chitosan + IL-2 (0.3) µIU
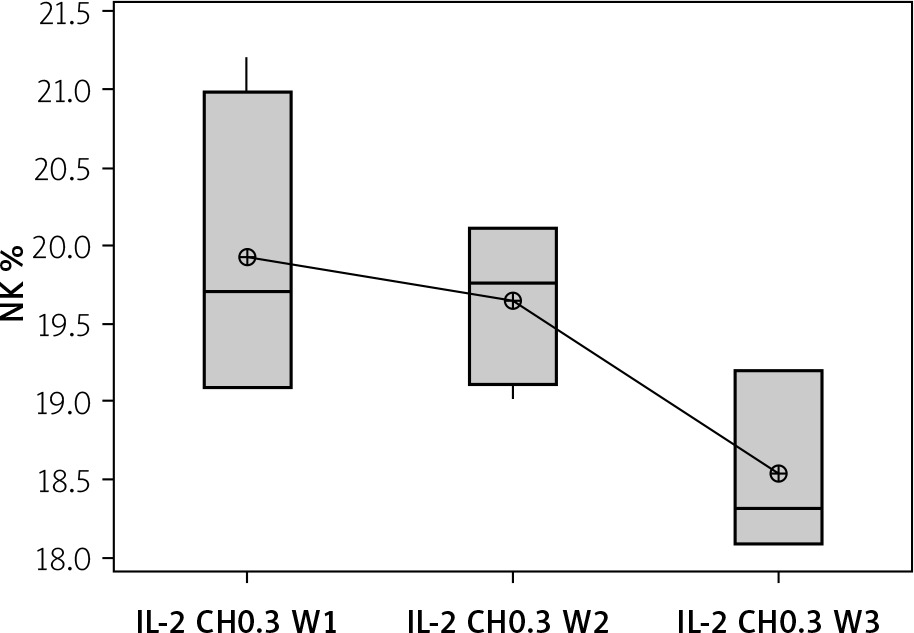
The effect of duration of treatment with IL-2-loaded chitosan (0.3 µIU) on NK cell and NKp46 expression
Our results showed a decrease in NK cell expression in the mice injected for 3 weeks with the 0.3 µIU dose of chitosan loaded with IL-2 (18.537 ±0.584%), but this reduction was not statistically significant between the 3 groups with different durations (p = 0.105), as shown in Figure 9.
Figure 9
Effect of duration of treatment with IL-2-loaded chitosan (0.3) µIU on NK cell expression in the 3 weeks. Data shown as percentage of expression by FACS. Group I: chitosan + IL-2 (0.3) µIU) represented by 7 diabetic mice treated for 1 week, Group II represented by 6 diabetic mice treated with chitosan + IL-2 (0.3) µIU for 2 weeks, and Group III represented by 6 diabetic mice treated with chitosan + IL-2 (0.3) µIU for 3 weeks
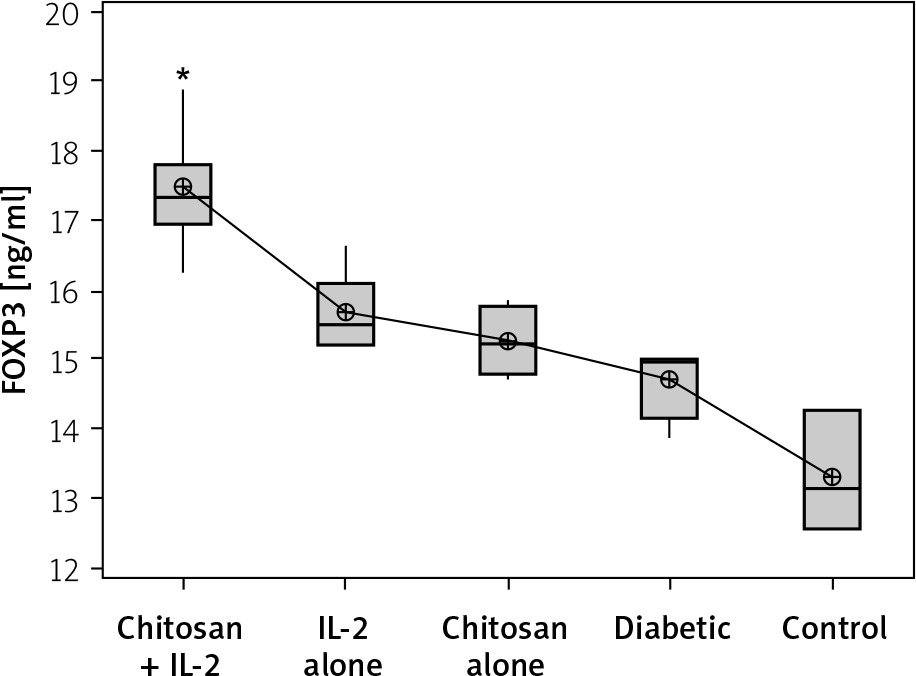
Expression of FOXP3
The Treg cells percentage and the cell lysate FOXP3 (ng/ml) were significantly more highly expressed in mice injected with IL-2-loaded chitosan than in the other groups (Figures 10 and 11).
Figure 10
Treg cell expression in different groups. Data shown as percentage of expression by FACS. Group I: chitosan + IL-2 represented by 51 diabetic mice treated with chitosan + IL-2 (0.3) µIU, Group II represented by 21 diabetic mice treated with IL-2 alone (0.3) µIU, Group III represented by 20 diabetic mice treated with chitosan alone (empty Chitosan), Group IV represented by 11 diabetic mice, and Group V represented by 8 non-diabetic mice
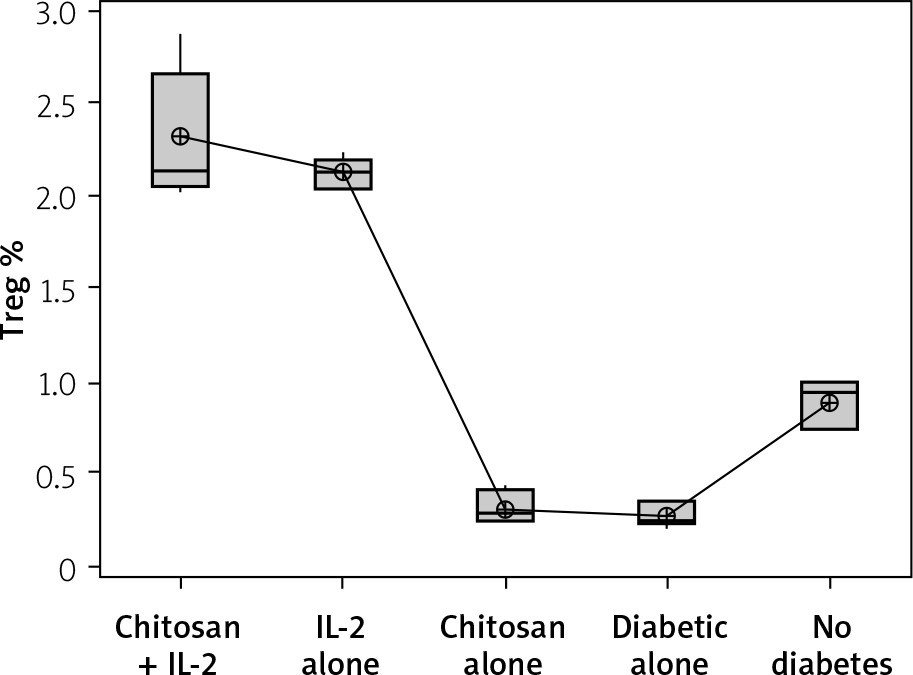
Figure 11
FOXP3 in cell lysate in different groups. Data shown as (ng/ml) by ELISA. Group I: chitosan + IL-2 represented by 51 diabetic mice treated with chitosan + IL-2 (0.3) µIU, Group II represented by 21 diabetic mice treated with IL-2 alone (0.3) µIU, Group III represented by 20 diabetic mice treated with chitosan alone (empty Chitosan), and Group IV represented by 11 diabetic mice and Group V represented by 8 non-diabetic mice
Our results showed a significantly statistical difference elevation with 0.3 µIU doses, as shown in Figure 12. This elevation was the highest in the third week (Figure 13).
Figure 12
Effect of changes of doses of IL-2 + chitosan on Treg cell expression. Data shown as percentage of expression by FACS. Group I: chitosan + IL-2 (0.05) µIU represented by 17 diabetic mice treated with chitosan + IL-2 (0.05) µIU, Group II represented by 17 diabetic mice treated with chitosan + IL-2 (0.1) µIU, and Group III represented by 17 diabetic mice treated with chitosan + IL-2 (0.3) µIU
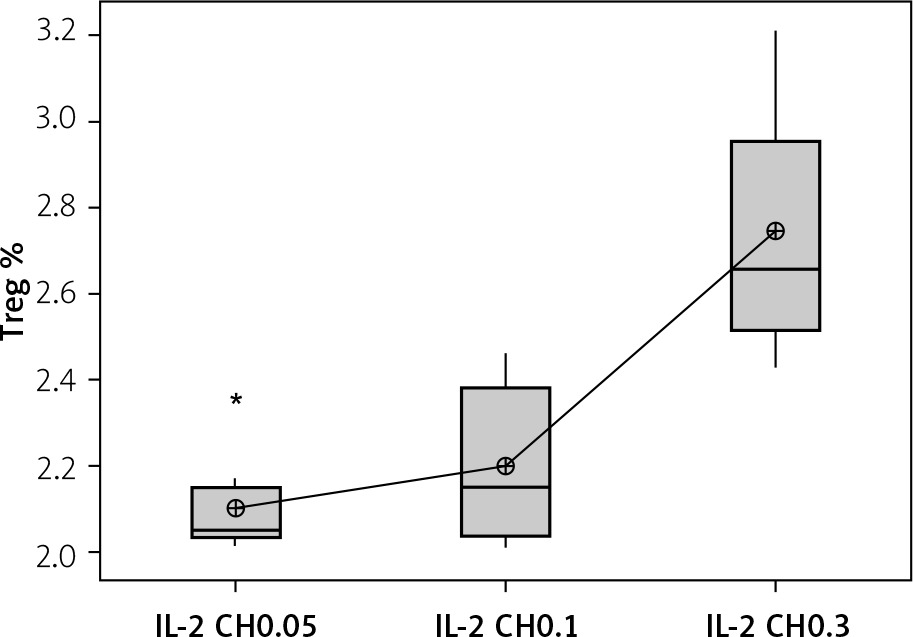
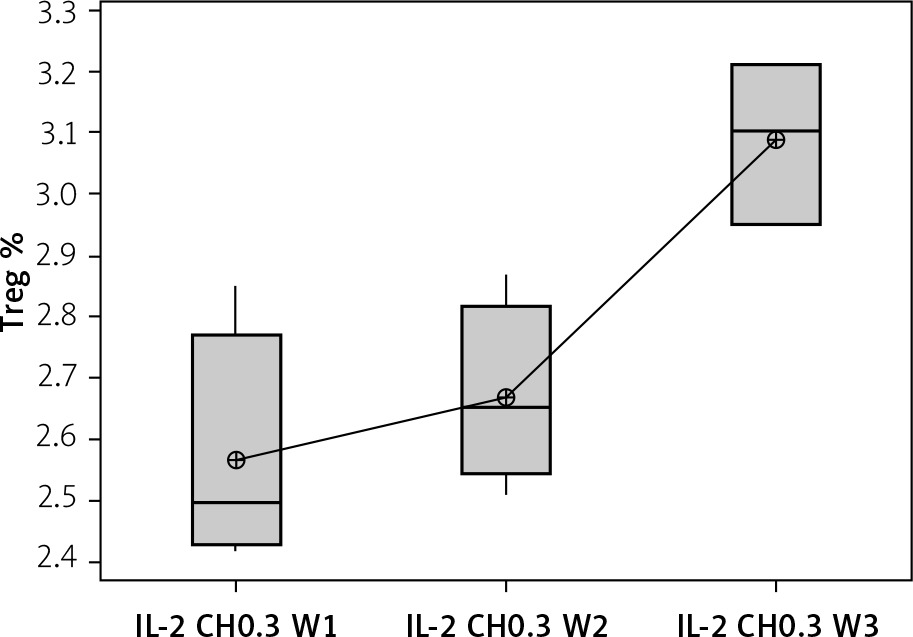
Figure 13
Effect of duration of treatment with IL-2-loaded chitosan (0.3) µIU on Treg cell expression in the 3 weeks. Data shown as percentage of expression by FACS. Group I: chitosan + IL-2 (0.3) µIU represented by 7 diabetic mice treated for 1 week, Group II represented by 6 diabetic mice treated with chitosan + IL-2 (0.3) µIU for 2 weeks, and Group III represented by 6 diabetic mice treated with chitosan + IL-2 (0.3) µIU for 3 weeks
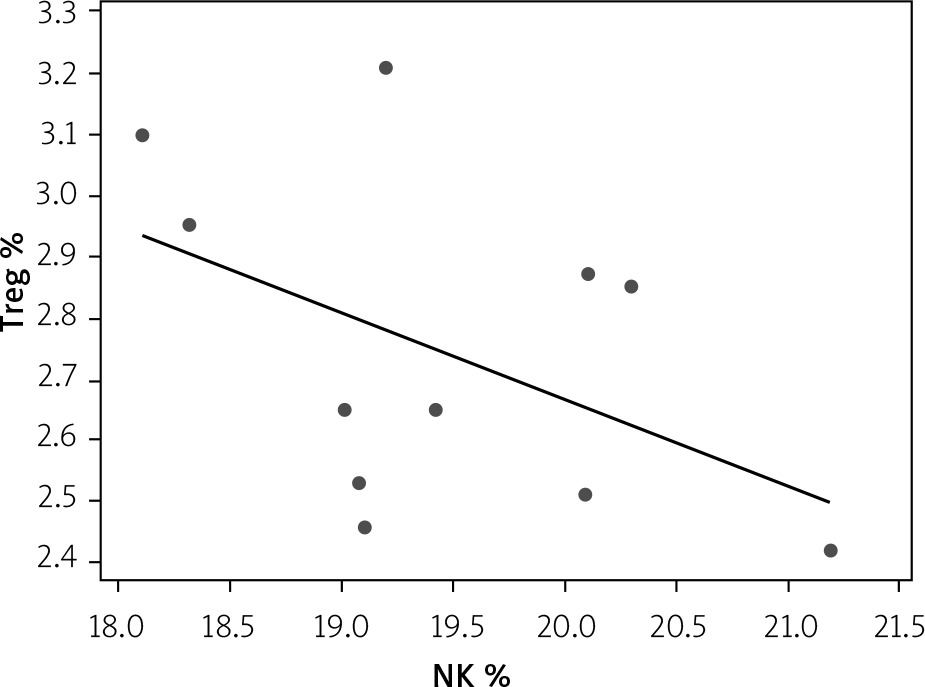
Correlation between Treg and NK expression in low-dose IL-2-loaded chitosan (0.3 µIU)-injected mice
A statistically significant inverse correlation was found between Treg and NK cell expression in mice treated with low-dose IL-2-loaded chitosan (0.3 µIU) (r = –0.473, p = 0.041) (Figure 14).
NK cell functional assay
Secretion of IFN-γ by cultured NK cells with Treg cells in the culture supernatant showed a significant decrease in the groups treated with chitosan-loaded IL-2 (p < 0.00) (Figure 15). This reduction was not significantly different between different doses (p = 0.586) (Figure 16). When we compare the 0.3 µIU dose of chitosan-loaded IL-2 in different duration of treatment, an insignificant difference also was found in the level of secreted IFN-γ in the culture supernatant (p = 0.839) (Figure 17).
Figure 15
IFN-γ in cell supernatant of co-cultured NK + Treg in different groups. Data showed as (pg/ml) by ELISA (Group I: chitosan + IL-2 represented by 51 diabetic mice treated with chitosan + IL-2 (0.3) µIU, Group II represented by 21 diabetic mice treated with IL-2 alone (0.3) µIU, Group III represented by 20 diabetic mice treated with chitosan alone (empty chitosan), Group IV represented by 11 diabetic mice, and Group V represented by 8 non-diabetic mice
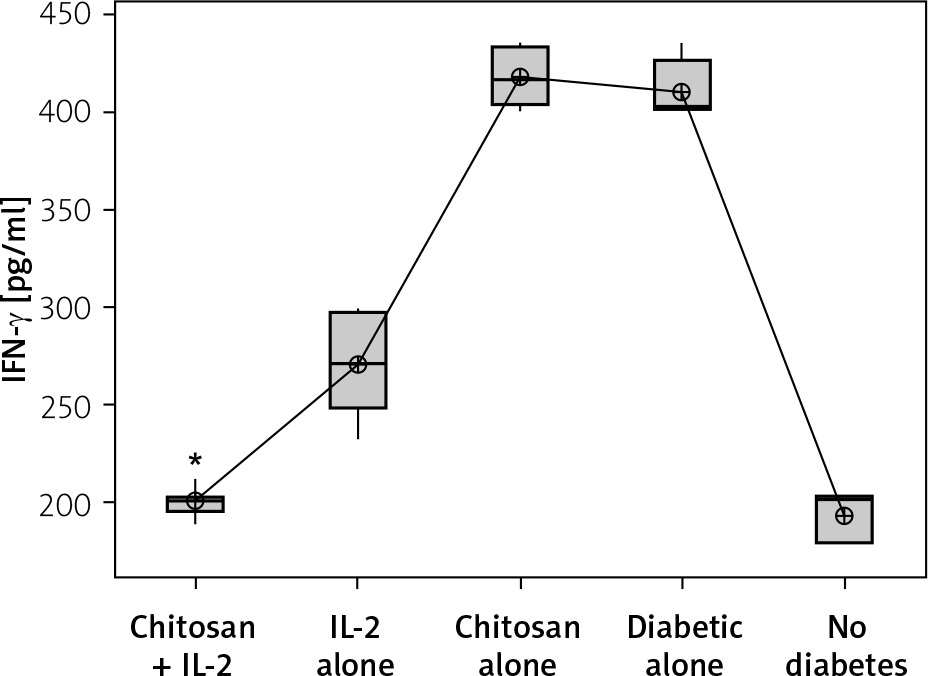
Figure 16
Effect of changes of doses of IL-2 + chitosan on IFN-γ secretion in culture supernatant. Data shown as (pg/ml) by ELISA. Group I: chitosan + IL-2 (0.05) µIU represented by 17 diabetic mice treated with chitosan+ IL-2 (0.05) µIU, Group II represented by 17 diabetic mice treated with chitosan + IL-2 (0.1) µIU, and Group III represented by 17 diabetic mice treated with chitosan + IL-2 (0.3) µIU
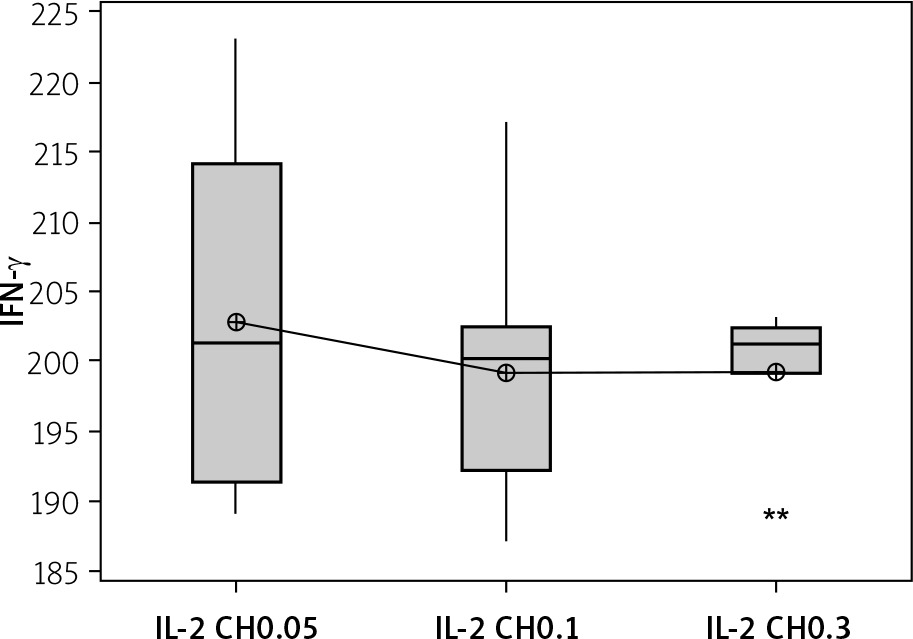
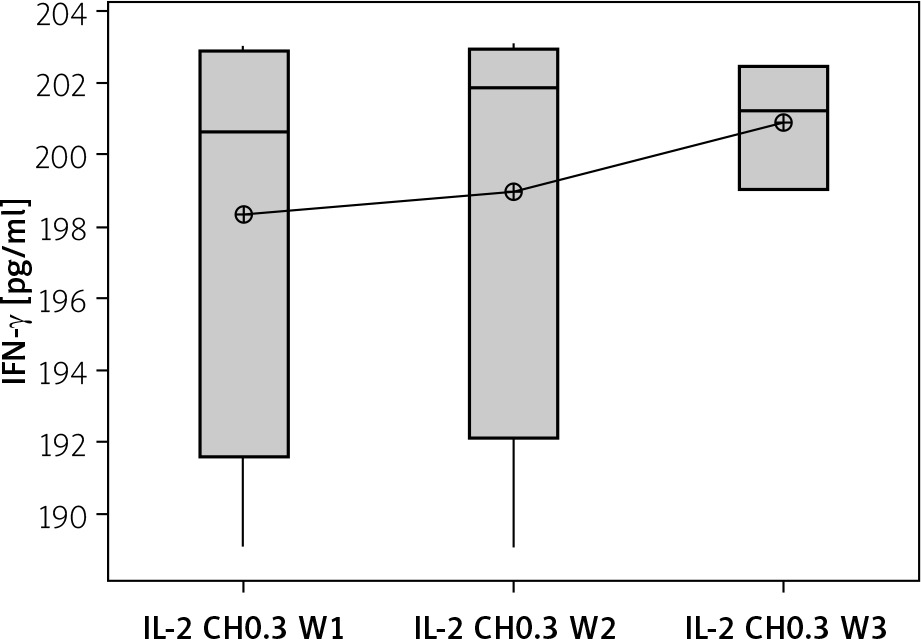
Figure 17
Effect of duration of treatment with IL-2-loaded chitosan (0.3) µIU on IFN-γ in cell supernatant of co-cultured NK+ Treg in different groups. Data shown as percentage of expression by FACS. Group I: chitosan + IL-2 (0.3) µIU represented by 7 diabetic mice treated for 1 week, Group II represented by 6 diabetic mice treated with chitosan + IL-2 (0.3) µIU for 2 weeks, and Group III represented by 6 diabetic mice treated with chitosan + IL-2 (0.3) µIU for 3 weeks
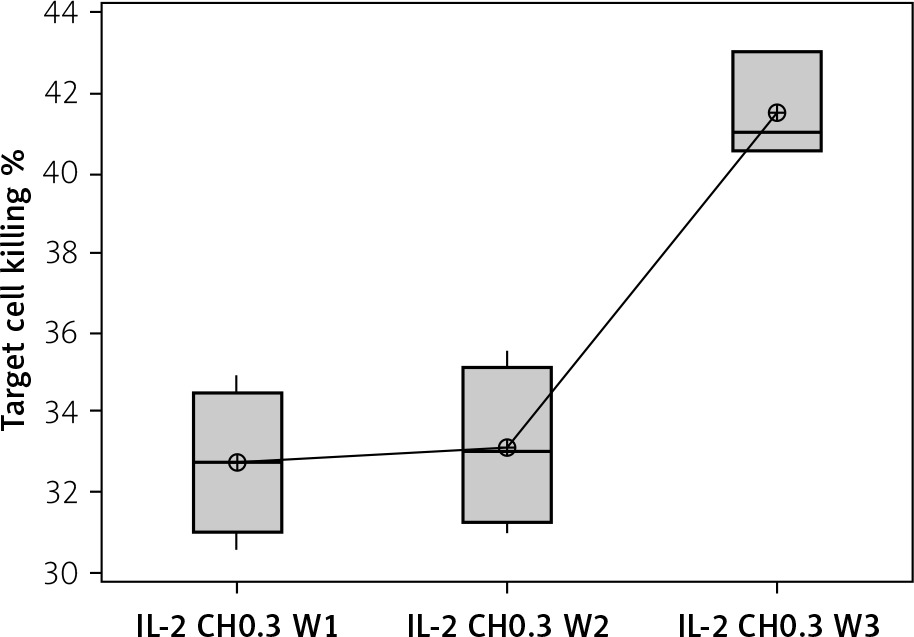
The percentage of target cell killing was significantly lower in mice injected with chitosan + IL-2 (p < 0.01) and between mice injected with this formulation and mice injected with IL-2 alone (p = 0.043) (Figure 18). This impairment of killing ability was significantly decreased with the 0.3 µIU dose of chitosan + IL-2 (p = 0.006). However, a change in the duration of treatment with this dose does not show any significant difference between mice injected for 1 week (=32.75 ±1.85%) or 2 weeks (33.13 ±2.02) with 0.3 µIU (p = 0.954) (Figure 19).
Figure 18
Cytotoxicity suppression assay: Data show target cell killing in co-cultured NK+ Treg in different groups. Data shown as percentage of killed cells. Group I: chitosan + IL-2 represented by 51 diabetic mice treated with chitosan + IL-2 (0.3) µIU, Group II represented by 21 diabetic mice treated with IL-2 alone (0.3) µIU, Group III represented by 20 diabetic mice treated with chitosan alone (empty chitosan), Group IV represented by 11 diabetic mice, and Group V represented by 8 non-diabetic mice
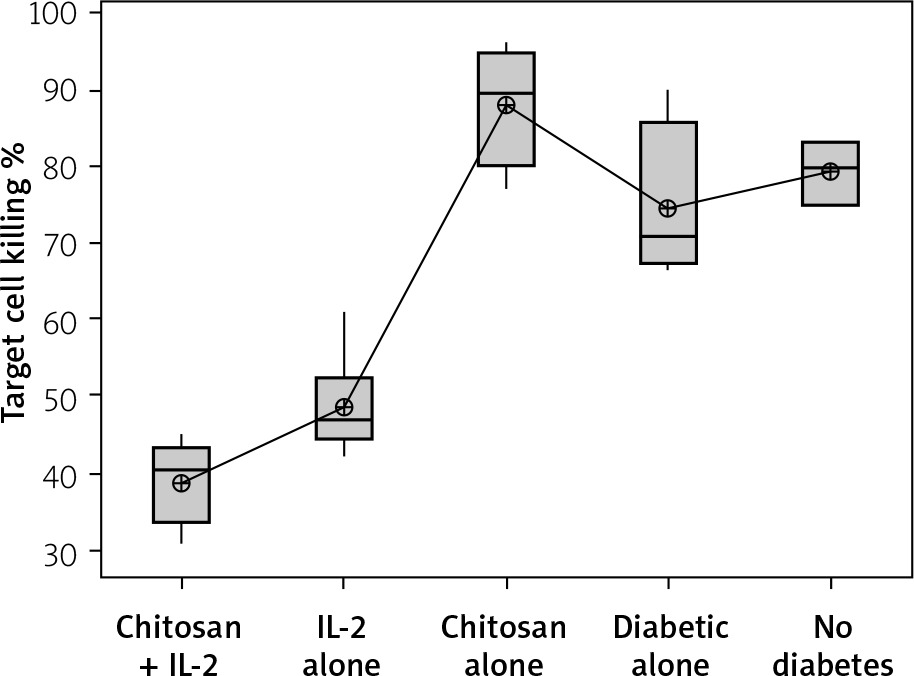
Figure 19
Effect of duration of treatment with IL-2-loaded chitosan (0.3) µIU on suppressive ability of Tregs on NK cells in co-cultures. Data show target cell killing in co-cultured NK+Treg in different groups as percentage of killed cells. Group I: chitosan + IL-2 (0.3) µIU represented by 7 diabetic mice treated for 1 week, Group II represented by 6 diabetic mice treated with chitosan + IL-2 (0.3) µIU for 2 weeks, and Group III represented by 6 diabetic mice treated with chitosan + IL-2 (0.3) µIU for 3 weeks
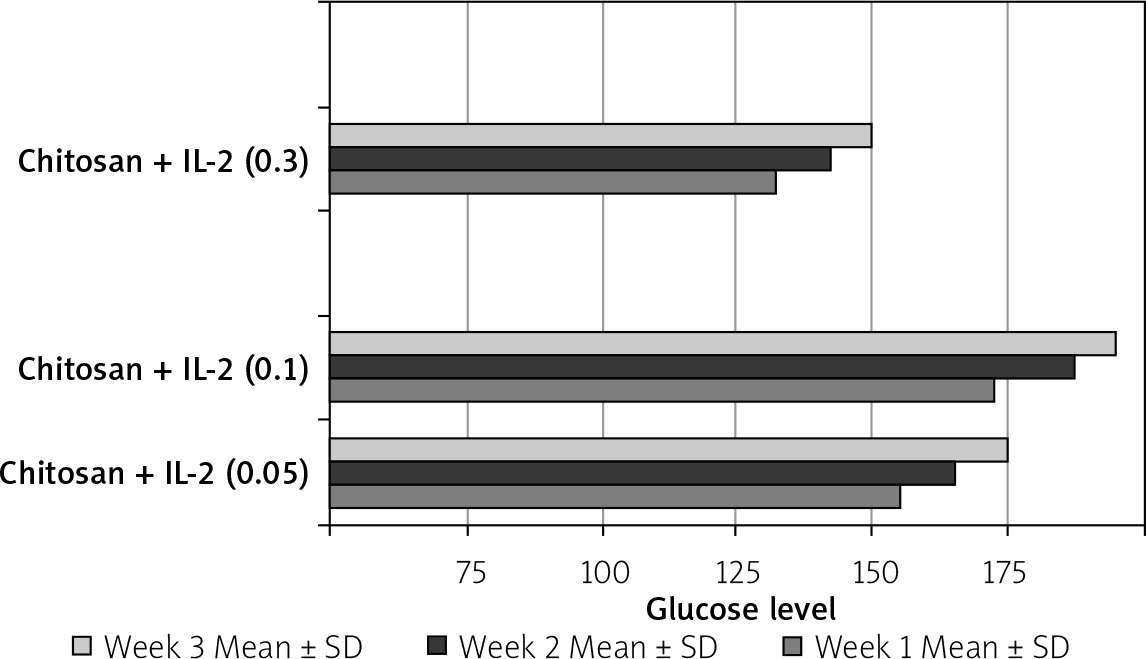
The effect of different formulations on glucose level and weight
This was shown in Table II and Figure 20.
Table II
Effect of treatment on glucose level and weight N: number of each group separately. Mean ± SD of weight, glucose level before and after STZ in the studied groups. P1 value between glucose level before and after treatment. P2 value between weight before and after treatment
Discussion
Autoimmune diabetes (type 1 diabetes) initiation and progression are primarily caused by Teff cells, but NKs have been identified in the pancreas of T1D patients and in experimental mouse models of T1D [34, 35]. At diabetes onset, there is an altered Teff/Treg ratio and increased IFN-γ production, aggravating autoimmunity in the pancreatic microenvironment, which is correctable with low-dose IL-2 [36].
Grinberg-Bleyer et al. described the significant role of IL-2 in the pancreatic microenvironment of non-obese diabetic mice (NOD) for Treg survival and function. The IL-2 pathway is impaired in NOD mice, and that is accompanied by decreased IL-2 levels [19]. There were suggestions that before the onset of the disease, Tregs consume predominantly IL-2, allowing for normal Treg numbers with an appropriate Teff/Treg ratio. It might be that Tregs have a competitive advantage in this microenvironment, based on their constitutive expression of IL-2Rs, which is higher than that expressed on CD25-expressing NKs or on activated T cells [37].
However, in the pancreatic microenvironment, the decrease in Tregs at disease onset might enable the accumulation of NKs. These IFN γ-producing NKs become activated and aggravate autoimmunity by boosting the responses of autoreactive Teff [38], or if exceedingly high doses of IL-2 are present [39]. Conversely, an appropriate low dose of IL-2 could enhance Tregs and promote regulation on these proinflammatory NKs, which has not yet been studied.
Low-dose IL-2 was studied to selectively stimulate Tregs and their regulatory function. Data emerging from T1D trials with these autologous Tregs demonstrate the limitations of protocols that rely on expanded Treg infusion without any recipient manipulation. The role of NKs in this context has not been established and needs to be understood in order to improve therapeutic strategies aimed at resetting the balance between Teff and Tregs. However, there are contradictory reports about NK involvement in autoimmune diabetes models describing both protective and destructive functions.
Together with their role to contribute to an inflammatory environment, NKs respond to IL-2 and compete for IL-2 during early diabetes development in mice, thus impacting immune-based therapies. So, it is a necessity to unravel the correlations between NK and Treg cells to better understand the controversial role of NKs in diabetes. Therefore, we aimed in this work to study the regulatory effect of low-dose IL-2 in experimentally induced diabetic mice on NK cells in relation to Treg cell expression.
Unfortunately, a former prescribed form of IL-2 (Proleukin) carried an explicit warning for exacerbation of a variety of autoimmune and inflammatory diseases [40]. Therefore, we created a new mode of delivering the low dose of IL-2 selectively to target cells by using chitosan nanoparticles. Chitosan has received growing attention mainly due to its ability to target specific delivery systems [41].
For this purpose, we prepared 3 formulations of IL-2 with 3 low doses (0.05, 0.1, and 0.3 µIU) loaded on chitosan nanospheres, and injected those at 3 weekly intervals in 3 groups of experimentally induced diabetic mice. Our main goal was to evaluate the effect of low-dose IL-2 on NK cells as a novel mechanism to set the balance between them and Tregs. This evaluation of NK expression was designed to assess the expression of NK cell in solenocytes as well as the NKp46 level and the NK cell cytotoxicity.
The use of NKp46 marker for identification of bulk NKs would be a very accurate measure of NK. Furthermore, the surface expression of NKp46 was found to be conserved on NK cells across mammalian species. On this basis, NKp46 could be a consistent marker to identify NK cells in different animal models. This comparison was not possible before because of the lack of a common and comprehensive receptor repertoire between dissimilar species [42].
We intended to compare the 3 doses of IL-2 to find the dose that has caused more NKP46 modulation at this new onset diabetes, then we monitored the statistical differences in levels of NKp46 and FOXP3 as markers of NK and Treg cell activity, respectively, from mice which injected with other formulations, including IL-2 alone or chitosan alone.
Our observations revealed conflicting results between surface expression of NKp46 on NK cells and their secreted form in cell lysate, while a decrease in the expression of NKp46+ NK cells was noticed in mice treated with the low-dose IL-2 loaded in chitosan. This reduction was significantly observed in the 0.3 µIU dose and in mice treated for 3 weeks. This could be related to findings of Hirakawa et al. (2016), which revealed the indirect effects of prolonged exposure to low concentrations of IL-2 on NK cells in vivo [43].
On the other hand, an elevation in the secreted level of NKp46 was observed in cell lysate in this group of mice. This could be explained by the findings of Ito et al. (2014), who found that NK cells are preferentially expanded by low-dose IL-2 in a dose-dependent manner, but their most prominent observed expansion was at the dose level of 200,000 IU/m [44]. Healthy humans express the ligand for the NKp46 receptor [34], and this could be impaired in diabetes. The expression of the NKp46 ligand is stable in functional β cells, and therefore β cells are constantly at risk of being attacked by NKs through NKp46-stimulatedactivation. In vitro, incubation of NKs with β cells leads to NK degranulation and β-cell killing. The NKp46 receptor was also found to be critical in diabetes development in vivo in low-dose STZ-diabetes in B6 mice [45].
The ability of NK cell killing and cytokine secretion showed an observed impairment when co-cultured with isolated Tregs. This suppressive capability of Treg was more prominent in mice treated with chitosan + IL-2 formulation. However, it showed no correlation to the dose or duration of this treatment. This indicates a critical role of Tregs in NK homeostasis, activation, and function, predominantly by controlling the availability of IL-2 in the microenvironment. Data from the Mathis group show that in the absence of Treg cells, NKs produce abundant IFN-γ and contribute to diabetic lesions in NOD mice. NKs were found to be initiators of autoimmune responses by stimulating CD4 T cells [46]. Additionally, IL-2 was the critical link between Treg and NKs in the pancreatic microenvironment [47].
Moreover, our results showed a statistically significant correlation between NKp46 and FOXP3 expression in IL-2-loaded chitosan group of mice receiving low doses (0.3 µIU). The maximum FOXP3 expression was observed at the dose of 0.3 µIU. This comes in non-accordance with Zorn et al. (2006), who found that the effect of IL-2 on FOXP3 expression in Tregs was detectable at concentrations as low as 0.1 U/ml, which probably target the high-affinity receptor for IL-2 [48]. Also in disagreement to our results, Tang et al. (2008) found that NOD mice treated with low-dose IL-2 in the form of an IL-2/anti-IL-2 mAb complex showed no difference in expression of NK cells [49], but this is obviously due to the different formulation they used. In addition, Baeyens et al. (2013) found that administration of low-dose IL-2 alone or combined with rapamycin counteracted IL-2 effects on Treg cells, failed to control IL-2–boosted NK cells, and broke IL-2-induced tolerance in a reversible way [40].
Our group is working nowadays on comprehensive mapping of the IL-2 signalling network to further elucidate the molecular mechanisms of IL-2, which could facilitate the development of specific agonists and antagonists to efficiently modulate immune responses.
Conclusions
Intraperitoneal injection of streptozotocin caused a state of hyperglycaemia which was associated with hyperinsulinaemia and weight loss. It was also observed that FOX-P3 results relative to chitosan encapsulation of IL-2 showed enhancing effect on FOXP3 expression relative to the free IL-2 at dose of 0.3 µIU. Concerning the NK cell marker (Nkp46), the results of chitosan encapsulation of IL-2 showed enhancing effect on Nkp46 expression relative to the free IL-2 at dose of 0.1 µIU. Prolonged administration of low-dose IL-2 results in enhanced expression of NKP46, indicating a significant role of Tregs in NK activation and function by controlling the availability of IL-2 in the microenvironment.
Recommendations
Modification of the adopted protocol of T1DM induction by STZ, in terms of drug dose, number of injections, and duration and strain of the experimental animals might be of interest in standardizing the conditions required for optimal induction of the disease.
Conducting the study on a higher number of mice to improve the statistical power for analysing mechanistic and biomarker data.
An important concern remains the possible interference of eosinophil activation induced by low doses of IL-2 therapy. This may pave the way for optimization of IL-2 therapy protocols in T1D aimed at enhancing antigen-specific Tregs.
Standardizing the contribution of IL-2 therapy on a wide range of other autoimmune disorders would be important for the foundation of future precision medicine.
Future studies directed towards comprehensively mapping the IL-2 signalling network and further elucidating the molecular mechanisms of IL-2 action to facilitate the development of specific agonists and antagonists and efficiently modulate immune responses.
Conducting functional assays to indicate a role for Tregs in NK homeostasis, activation, and function by controlling the availability of IL-2 in microenvironment.
We hope that the present study may add significant information about the cellular mechanisms involved in the pathogenesis of type 1 DM in its wild type or experimentally induced versions. We believe that the interplay of counter-regulatory mechanisms in localized inflammatory settings such as Treg cells and NK cells might determine, to a great extent, the outcome of the total inflammatory process, either towards the establishment of autoimmune diseases or spontaneous recovery. Nonetheless, we believe that other molecular and cellular determinants of inflammation may have their own contribution; subsequently, extensive research among other cellular components such as cytotoxic T cells and Teff cells is important. In addition, the genetic background of the animal strain, other than BALB/c adopted in the current study, might influence the results. Study of the long-term effects of IL-2 treatment as well as manipulation of the experimental design in terms of IL-2 concentration, number and site of injections, and follow-up durations may also alleviate many of the obstacles during optimization of the IL-2 therapeutic modality.