Introduction
Chronic obstructive pulmonary disease (COPD) is an irreversible progressive airway obstructive disease that belongs to preventable diseases; the global incidence rate is about 4–10%. The main clinical symptoms of patients are dyspnoea, cough, expectoration, etc. [1]. China is a country with a high incidence of COPD, with middle-aged and elderly people as the main disease group. The incidence rate of COPD in middle-aged people over 40 years old is about 13.7%, and that in elderly people over 60 years old is 27%. COPD has a certain mortality rate, which is often caused by the patient’s condition entering an acute exacerbation phase, increased inflammatory reactions in the respiratory system, aggravating the degree of airflow restriction, leading to worsening of hypoxia symptoms, and ultimately inducing respiratory failure. COPD has the characteristic of recurrent attacks, especially in severe COPD patients, with an average of about 2 acute exacerbations per year. This recurrent attack can cause a significant burden on the patient’s physical health, psychological state, and economic situation. Therefore, it is of great clinical significance to seek biomarkers that can predict the clinical symptoms and prognosis of patients with acute exacerbation of COPD [2, 3].
Eosinophils (EOS) are a component of white blood cells derived from bone marrow hematopoietic stem cells, accounting for approximately 1% to 4% of white blood cells. Previously, it was believed in clinical practice that after COPD patients entered the acute exacerbation phase, a large amount of neutrophil-related inflammatory factors were released, and an increase in EOS count levels was observed in 40% of COPD patients during the acute exacerbation phase [4]. Research has found that peripheral blood EOS count can reflect the degree of airway inflammatory response in COPD patients to a certain extent, and is of great value for studying the onset and prognosis of COPD patients in the acute exacerbation stage [5, 6]. With the improvement of clinical researchers’ understanding of EOS, more and more studies have confirmed a strong correlation between peripheral blood EOS count and the development and prognosis of acute exacerbation of COPD.
Aim
Therefore, based on previous relevant results, this study summarizes the relationship between peripheral blood EOS levels and the clinical development and prognosis of COPD patients.
Material and methods
Literature retrieval strategy
The literature search was conducted in English databases such as PubMed, Embase, Web of Science, Cochrane Library, etc. using English search terms such as “COPD”, “AECOPD”, “chronic obstructive pulmonary disease”, “Eosinophils”, “Eosinopenia”, “Eosinophilia”, “Eosinophil”, etc.. Then, literature search was conducted in Chinese databases such as CNKI and Wan Fang Data using search terms such as “chronic obstructive pulmonary disease”, “chronic obstructive pulmonary disease”, “acute exacerbation of chronic obstructive pulmonary disease”, “COPD”, “AECOPD”, “eosinophils”, and “EOS”. From the establishment of the database until July 2023, all published articles were searched.
Inclusion and exclusion criteria
Inclusion criteria: (1) The study subjects are adult and meet the diagnostic criteria for COPD; (2) Adopting cross-sectional or retrospective studies; (3) Group comparison based on peripheral blood EOS levels, with 2% as the cut-off level; (4) Including at least one pathological or prognostic indicator; (5) Chinese or English literature.
Exclusion criteria: (1) Articles published in the form of reviews, meta-analyses, and conference abstracts; (2) Clinical research on non-human subjects such as animal experiments and cell culture; (3) Repeated publication of articles; (4) Incomplete data; (5) Unable to obtain complete article content.
Literature screening and information extraction
Literature screening was jointly and independently performed by two researchers, and the selected articles were imported into ENDNOTE X9 software for management; firstly, they read the title and abstract, preliminarily screened the articles that did not meet the requirements, and then carefully read the content of the articles for detailed screening. Two researchers checked the inclusion and screening results of the articles, and conducted internal discussions and analysis of the articles with differences. If necessary, a third party could make a ruling.
Information extraction. Two researchers jointly and independently extracted information, which was mainly divided into three aspects: (1) article features, including publication time, first author of published articles, etc.; (2) characteristics of the research object, including the number of patients included, grouping situation, number of patients in each group, gender, age, etc.; (3) characteristics of outcome indicators. This study mainly included GOLD grading, FEV1%pred, FEV1/FVC, length of stay, mortality rate, readmission rate, mechanical ventilation usage rate, and CAT score. If multiple time periods of indicator levels were given in the article, the level of the patient’s acute exacerbation period indicator was the main one, followed by the level at admission or before treatment.
Risk assessment of literature bias
The Cochrane bias risk assessment tool was used to evaluate the bias risk of the articles included. The degree of bias risk for each dimension was divided into three levels: low risk, unclear risk, and high risk. Two researchers continued to independently evaluate and compare the results. If there were differences in the evaluation results, negotiation and discussion were conducted. If a unified result could not be obtained, a third-party researcher was sought for final evaluation.
Statistical analysis
Statistical analysis was conducted using RevMan 5.3 software, and binary variables such as GOLD grading, mortality rate, readmission rate, and mechanical ventilation usage rate in the articles were represented by the number of cases (n) and it used odds ratio (OR) for effect quantity consolidation, and continuous variables such as FEV1%pred, FEV1/FVC, hospital stay, CAT score, etc. were represented by mean difference (MD) or standard mean difference (SMD). If the data provided in the study were median and quartile, the median was converted to mean, quartile range, and quartile interval to standard deviation, and the 95% confidence interval (95% CI) was calculated. I2 and P evaluation were used to test the heterogeneity between studies, and an analysis effect model was selected based on heterogeneity. I2 < 50% or p > 0.1 represented no significant heterogeneity and a fixed effect model was selected. I2 ≥ 50% or p ≤ 0.1 represented significant heterogeneity and a random effect model was selected.
Results
Literature search and screening results
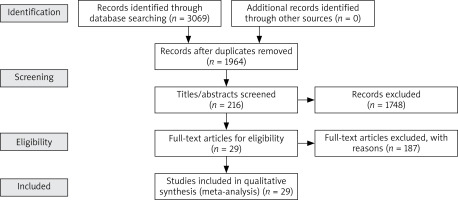
A total of 3069 references were obtained through computer retrieval, with 1964 remaining after removing duplicate references. 1749 articles were excluded through reading titles and abstracts, and 187 articles were excluded after reading the entire text. Finally, 29 articles were included, as shown in Figure 1.
Basic characteristics and quality evaluation of articles included
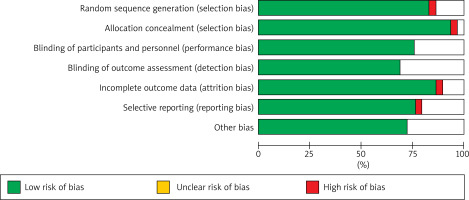
Among the 29 articles ultimately included, 11 were in English and 18 were in Chinese. The basic characteristics of the articles are detailed in Table 1 [7–35], and the quality evaluation of the articles is shown in Figure 2.
Table 1
Basic characteristics of articles included
| Number | Included studies | Time | Sample size | Sample size | Age | Male proportion | Outcome indicators | |||
|---|---|---|---|---|---|---|---|---|---|---|
| EOS% ≥ 2% | EOS% < 2% | EOS% ≥ 2% | EOS% < 2% | EOS% ≥ 2% | EOS% < 2% | |||||
| 1 | Bélanger [7] | 2018 | 479 | 173 | 306 | 68.7 ±9.4 | 69.1 ±9.4 | 98 | 151 | ①②③④⑤⑥⑦ |
| 2 | Choi [8] | 2019 | 736 | 190 | 546 | 71.6 ±10.5 | 72.5 ±8.9 | 140 | 378 | ①②③④⑤ |
| 3 | Cui [9] | 2021 | 1566 | 668 | 898 | 69 ±9.63 | 69 ±8.89 | 555 | 702 | ③④ |
| 4 | Cuneyt [10] | 2015 | 647 | 62 | 585 | – | – | 51 | 472 | ⑤ |
| 5 | Disantostefano [11] | 2016 | 948 | 634 | 314 | – | – | 425 | 185 | ① |
| 6 | Emine [12] | 2018 | 10593 | 4056 | 6537 | 67 (59–75) | 69 (61–77) | 2931 | 4325 | ⑤ |
| 7 | Lv [13] | 2021 | 174 | 76 | 98 | 64.74 ±9.55 | 66.43 ±10.26 | 54 | 97 | ①②③⑤④⑦⑧ |
| 8 | Prins [14] | 2017 | 207 | 39 | 168 | 70.4 ±8.7 | 69.7 ±11.5 | 23 | 78 | ②③⑤⑥ |
| 9 | Tang [15] | 2020 | 247 | 97 | 150 | 72 ±11.11 | 72 ±8.89 | 74 | 119 | ②③ |
| 10 | Wu [16] | 2020 | 625 | 176 | 449 | 74.9 ±11.74 | 76.89 ±10.09 | 166 | 384 | ②③④⑤⑥⑦ |
| 11 | Zeng [17] | 2021 | 703 | 312 | 391 | 75.8 ±9.7 | 76.2 ±9.2 | 272 | 344 | ①④ |
| 12 | Fu [18] | 2018 | 109 | 50 | 59 | 64.04 ±10.53 | 68.02 ±11.10 | 29 | 39 | ①④ |
| 13 | Liu [19] | 2017 | 148 | 37 | 111 | 69.5 ±5.5 | 71.5 ±5.6 | 29 | 95 | ①②④⑧ |
| 14 | Liu [20] | 2023 | 116 | 47 | 69 | 66.96 ±10.27 | 67.75 ±10.91 | 30 | 43 | ②③④⑤⑥⑦ |
| 15 | Bie [21] | 2022 | 184 | 68 | 116 | 69 ±8 | 70 ±8 | 34 | 67 | ① |
| 16 | Wu [22] | 2016 | 149 | 37 | 112 | – | – | 30 | 96 | ①④ |
| 17 | Ji [23] | 2020 | 140 | 48 | 50 | 65.7 ±5.7 | 67.1 ±7.4 | 39 | 40 | ②③⑤⑥⑧ |
| 18 | Cui [24] | 2020 | 216 | 92 | 124 | 67.5 ±7.2 | 66.1 ±6.3 | 70 | 82 | ①②③④⑦ |
| 19 | Zhang [25] | 2018 | 68 | 34 | 34 | 66.21 ±7.64 | 67.41 ±6.71 | 26 | 22 | ④⑤⑥ |
| 20 | Peng [26] | 2018 | 122 | 36 | 52 | 66.9 ±7.7 | 67.9 ±8.4 | – | – | ③⑧ |
| 21 | Zeng [27] | 2017 | 559 | 241 | 318 | 74.9 ±9.3 | 75.3 ±8.8 | 2003 | 273 | ①③④ |
| 22 | Li [28] | 2020 | 120 | 56 | 64 | 67.51 ±11.97 | 69.83 ±10.42 | 56 | 59 | ②④⑧ |
| 23 | Wang [29] | 2019 | 197 | 41 | 156 | 73.8 ±5.9 | 73.6 ±5.7 | 34 | 116 | ①②③⑥ |
| 24 | Dong [30] | 2021 | 88 | 25 | 63 | 72 ±8 | 72 ±8 | 18 | 43 | ①②③④ |
| 25 | Fei [31] | 2017 | 82 | 16 | 66 | 74.4 ±8.1 | 74.7 ±8.3 | 11 | 45 | ④⑤ |
| 26 | Zheng [32] | 2016 | 729 | 276 | 453 | 71.1 ±9.9 | 72.5 ±10.2 | 202 | 306 | ④⑤ |
| 27 | Guo [33] | 2020 | 157 | 78 | 79 | 67.74 ±8.27 | 70.43 ±7.80 | 51 | 51 | ①②④③ |
| 28 | Jin [34] | 2017 | 318 | 45 | 273 | 74.04 ±7.86 | 75.12 ±8.93 | 34 | 213 | ④⑤ |
| 29 | Lu [35] | 2017 | 1200 | 420 | 780 | 67.2 ±8.9 | 69.1 ±8.6 | 64 | 68 | ②③⑤⑥ |
Meta-analysis results
Meta-analysis of different EOS levels in disease-related indicators of COPD patients
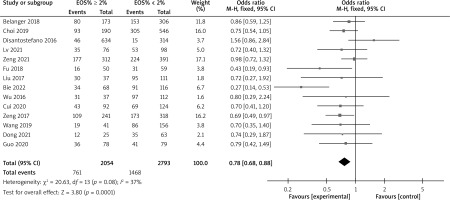
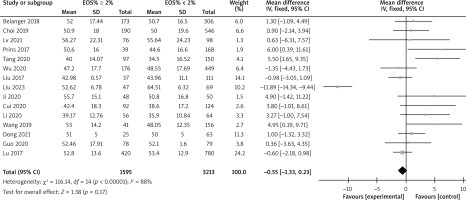
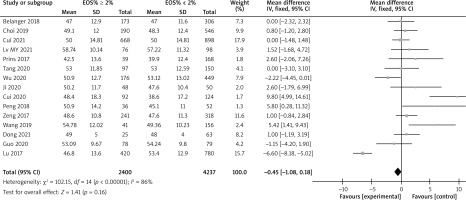
There are a total of 14 articles comparing the “GOLD grading” indicators of COPD patients with different levels of EOS. The forest map demonstrates that among COPD patients with high levels of EOS, the proportion of patients with grade III–IV GOLD grading is relatively low (p < 0.05), as shown in Figure 3. There are a total of 15 articles comparing the “FEV1%pred” indicators of COPD patients with different EOS levels. The forest map demonstrates that the FEV1%pred levels of COPD patients with different EOS high levels are basically the same (p > 0.05), as shown in Figure 4. There are a total of 15 articles containing “FEV1/FVC” indicator pairs for COPD patients with different EOS levels. The forest map demonstrates that the FEV1/FVC levels of COPD patients with different EOS high levels are basically the same (p > 0.05), as shown in Figure 5. There are 5 articles comparing the “CAT score” indicators of COPD patients with different EOS levels. The forest map demonstrates that the CAT score of COPD patients with high EOS levels is lower (p < 0.05), as shown in Figure 6. The meta-analysis results of different EOS levels in the disease-related indicators of COPD patients showed that except for the “CAT score” indicator, the heterogeneity test results of other indicators showed heterogeneity between studies, and a random effects model was adopted for analysis. The “CAT score” indicator was analysed using a fixed effects model, as shown in Table 2.
Table 2
Meta-analysis results of different EOS levels in disease-related indicators of COPD patients
Meta-analysis of prognostic indicators related to different levels of EOS in COPD patients
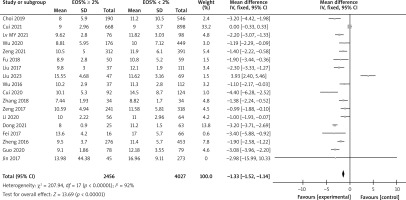
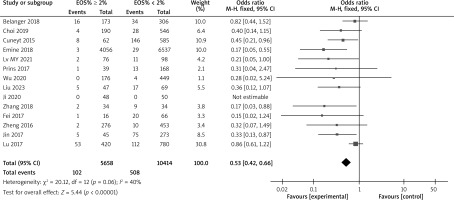
There are a total of 18 articles comparing the “hospital stay” indicators of COPD patients with different levels of EOS. The forest map demonstrates that patients with high levels of EOS have a shorter hospital stay (p < 0.05), as shown in Figure 7. There are 14 articles comparing the “mortality rate” indicators of COPD patients with different levels of EOS. The forest map demonstrates that patients with high levels of EOS have a lower mortality rate (p < 0.05), as shown in Figure 8. There are a total of 6 articles comparing the “readmission rate” indicators of COPD patients with different levels of EOS. The forest map demonstrates that patients with high levels of EOS have a lower readmission rate (p < 0.05), as shown in Figure 9. There are 5 articles comparing the “mechanical ventilation usage rate” indicators of COPD patients with different EOS levels. The forest map demonstrates the differences in mechanical ventilation usage rate among COPD patients with different EOS levels (p > 0.05), as shown in Figure 10. The meta-analysis results of different EOS levels in the disease-related indicators of COPD patients showed that the heterogeneity test results of all indicators showed heterogeneity between studies, and a random effects model was adopted for analysis, as shown in Table 3.
Table 3
Meta-analysis of prognostic indicators related to different levels of EOS in COPD patients
Discussion
The epidemiological investigation results show that with a cutoff value of 2% for peripheral blood EOS, the detection rate of EOS induced airway inflammation in patients with acute exacerbation of COPD is about 40%, indicating a close relationship between peripheral blood EOS levels and the development of the patient’s condition [36]. Meanwhile, in 2020, the American Thoracic Society (ATS) recommended in its COPD treatment guidelines [37] that peripheral blood EOS ≥ 2% be used as the standard for glucocorticoid inhalation therapy in patients with acute exacerbation of COPD, indicating that peripheral blood EOS is also involved in COPD treatment.
Meta-analysis of the correlation between peripheral blood EOS levels and lung function in COPD patients
The meta-analysis results in this study showed that compared to conventional EOS levels, COPD patients with high EOS levels had a lower proportion of patients with grade III–IV GOLD grading and lower CAT scores. However, COPD patients with different EOS levels had similar levels of FEV1%pred and FEV1/FVC. Fu et al. [18, 23] pointed out in their study that the proportion of patients with high EOS levels in the GOLD grading of COPD patients at levels III-IV was higher than that of patients with conventional EOS levels. This is consistent with the results of this study, indicating that the respiratory resistance symptoms of COPD patients with high EOS levels are relatively lower than those of patients with conventional EOS levels. However, the results of this study are inconsistent with those of Liu et al. [19, 21, 22, 29, 33], which may be related to the number of subjects included in different studies and the age of patients. Bélanger et al. [7] pointed out in their study that there was no difference in FEV1%pred and FEV1/FVC levels between COPD patients with high EOS levels and those with conventional EOS levels, which is consistent with the results of this study. There is no significant correlation between serum EOS levels and respiratory resistance symptoms in COPD patients, which is inconsistent with the comparison results of the “GOLD grading” index in this study. The reason for this result is that the meta-analysis results of the two outcome indicators are not completely the same, there may be differences in the results. At the same time, this study also included the “CAT score” as an outcome measure, which is a subjective evaluation scale for evaluating the impact of COPD patients’ quality of life in clinical practice. In this study, COPD patients with high EOS levels had lower CAT scores, indicating that COPD patients with high EOS levels had milder clinical symptoms, consistent with the results of Turato et al. [38]. Based on the above theoretical analysis results, it is inferred that the process of COPD patients entering the acute exacerbation phase is weakly related to the increase in EOS levels, but an increase in EOS levels is beneficial for improving the clinical symptoms of patients.
Meta-analysis of the correlation between peripheral blood EOS levels and prognosis in COPD patients
The meta-analysis results in this study showed that compared to conventional EOS levels, COPD patients with high EOS levels had shorter hospital stays, lower mortality rates, and lower readmission rates. However, there was no statistically significant difference in mechanical ventilation usage among COPD patients with different EOS levels. EOS has the ability to regulate innate and adaptive immunity in the human body to combat infection and inflammatory reactions. Studies have shown that peripheral blood EOS count levels decrease with acute bacterial infections [39]. Therefore, COPD patients with high EOS levels have higher immune function, faster recovery, shorter hospital stay, lower mortality and readmission rates. Research has shown that the level of EOS at patient admission may have a potential predictive effect on all-cause mortality at 30 days of follow-up [40]. In addition, research has been conducted on the use of Benralizumab to prevent the deterioration of COPD and reduce mortality [41].


