


INTRODUCTION
Bipolar disorder (BD) remains a significant clinical challenge in psychiatry, particularly due to its recurrent, chronic nature and profound impact on patients’ quality of life and social dynamics [1, 2]. Globally, the prevalence of this mental disorder is estimated at approximately 2-3% [2]. BD manifests in highly variable psychopathological symptoms, encompassing episodes of mania, depression, and mixed states of varying severity. More than one in five patients who are prescribed mood stabilizers, in accordance with international guidelines, face a high risk of episode recurrence within a year [3]. Patients with BD demonstrate a higher mortality rate compared to the general population [4], exacerbated by molecular changes in the brain (kindling) that worsen with successive episodes [5, 6]. Effective management of BD hinges significantly on pharmacotherapy and comprehensive patient education to enhance self-awareness of the illness (deep psychoeducation) [7]. Technological advancements that employ machine learning offer promise in providing patients with rapid and objective indicators of impending episodes [8-10]. These innovations may mitigate the severe consequences of BD by inviting early intervention and personalized treatment approaches.
Previous studies have demonstrated that during periods of remission, individuals with BD willingly adopt smartphone applications to monitor their mental states [11, 12]. These applications are well-received for their ease of use and perceived effectiveness, leading to improved patient adherence to treatment recommendations and heightened satisfaction [13, 14]. Real-time collection of patients’ objective assessments (active data) via mobile applications mirrors naturalistic behavioral and speech patterns. Furthermore, these objective data align with established depression (Hamilton Depression Rating Scale [HDRS]) and mania (Young Mania Rating Scale [YMRS]) scales [8, 15-19]. BD often disrupts patients’ activity control and regularity of daily rhythm [20], making continuous self-monitoring through technological advancements crucial in managing daily activities. Previous research has highlighted challenges faced by patients in consistently completing daily surveys [21]. Consequently, alternative methods for passive data collection, without requiring active patient’s involvement, have been explored alongside traditional approaches. Recent findings indicate that data from passive objective monitoring during depressive and manic phases correlate with scores from the HDRS and YMRS scales. These behavioral markers include metrics such as physical activity levels, telephone usage patterns, and physical parameters of voice and mobility [8, 16-18]. Consequently, behavioral data collected through applications can effectively assess mental state and even predict changes [19]. Importantly, passive data collection requires no active participation from patients. This feature may offer an advantage in managing BD, where the onset of episodes can be subtle – referred to as subliminal – and may escape patient and social detection, even by close contact. The sensitivity and objectivity of clinical assessments are crucial in detecting early symptoms and mitigating the passive nature of the disease. However, both passive and active smartphone-based monitoring hold promise in evaluating disease activity among BD patients.
The clinical significance of remote data transmissions from applications lies in its capacity to enable psychiatrists to make informed decisions regarding necessary therapeutic interventions [8, 22]. Currently, researchers highlight promising clinical prospects for monitoring patients’ mental states; however, they stress the critical need for further methodologically rigorous research. Such studies are essential for developing and integrating these modern tools into prevention and treatment strategies [23, 24].
In clinical practice, treatment of episodes often begins late, after symptoms have significantly worsened [25]. This delay is partly attributed to the limited availability of healthcare specialists, resulting in routine clinical assessments occurring every few weeks or months [26]. While data from applications cannot replace direct psychiatric examination, continuous monitoring through these tools provides the advantage of more frequent assessments compared to standard therapy protocols. This ongoing monitoring has the potential to detect early signs of deterioration and optimize timely intervention strategies.
During episodes of BD, particularly in mania or hypomania, patients may exhibit impaired insight into their condition and reduced critical awareness, leading to avoiding contact with a psychiatrist despite escalating symptoms. In such cases, objective data collected from applications can be especially valuable. However, it is important to note that during these phases, subjective assessments provided by patients to the monitoring system may be less reliable [19, 26, 27].
Passive monitoring also has its limitations, including the discomfort associated with being under constant observation, the inconvenience of wearing a wristband during sleep, and the need to remove it for activities such as showering [12]. Additionally, there are challenges in collecting, analysis, and processing of sensitive personal data while ensuring strict and dependable data security protocols [28]. Current efforts are focused on developing robust regulatory frameworks for these practices [29].
This study investigated the hypothesis that increased patient involvement through the active transmission of objective voice parameters enhances the effectiveness of the MoodMon mobile application in predicting mood changes in patients with bipolar disorder. This analysis is a crucial component of a broader, comprehensive clinical study evaluating the application’s overall utility.
METHODS
To begin with, the description of the methods, abbreviations and terms used are presented in Table 1 and illustrated by Example.
Table 1
Artificial Intelligence terms and abbreviations
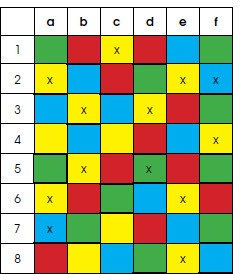
Example
In the picture below, the AI algorithm was tasked with marking all yellow squares with an x. From among 14 yellow squares, it marked 10 (true positive results) and missed 4 (false negative results). It wrongly classified 2 blue squares as yellow (false positive results) and correctly did not mark the remaining 35 squares (true negative results). This algorithm has a sensitivity of 10/14 = 71% and a specificity of 35/48 = 73%.
Data acquisition in clinical study
The clinical study was conducted in Poland from 2021 to 2023 and with the approval from the Bioethical Commission at the District Medical Chamber in Poznań (agreement KB 170/2021). The study included 75 patients diagnosed with bipolar affective disorder (BD) type I or II. The sample consisted of 42 women, and 33 men, each of whom had experienced a minimum of two mood shifts within the past year.
Each enrolled patient received a dedicated mobile smartphone application called MoodMon, which collected data on their physical and social activity, sleep quality, and voice parameters. Data on social activity, including phone and application usage, were extracted directly from the phone, while physical activity and sleep data were obtained from a wristband. Voice parameters were gathered through a voice survey conducted via the mobile application using the phone’s microphone. The voice survey consisted of the patient’s responses to three emotionally neutral questions. Daily recordings were processed, and acoustic features were analyzed using advanced analytics systems. Notably, the content of the voice samples was not examined. Psychiatric assessments were conducted using a specialized web application designed for psychiatrists, which is a platform that facilitated the collection of detailed patient data and allowed for comprehensive documentation of the course of the illness. Throughout the clinical study, it served as an electronic case report form (eCRF) for storing medical trial documentation. The data contained in this publication and used for statistical calculations come from 350 days of the second phase of the study, when the AI analytical engine was running and the MoodMon application sent alerts. The overall project was further extended with the consent of the bioethics committee.
Psychiatric assessment and data collection
Patients’ mental state was evaluated by experienced psychiatrists specializing in the bipolar disorder diagnosis and treatment. Throughout the study, both researchers and patients were blinded to the data automatically collected by the MoodMon application.
Patients were required to visit the researcher at least once every 3 months. At the initial visit, clinical and demographic data were collected, and the patient’s mental state was assessed. Primary outcome measures, including the 17-item versions of the HDRS and the YMRS, were administered during these in-person visits, with remote formats allowed due to the COVID-19 pandemic. The Clinical Global Impressions (CGI) scale was used to standardize assessments, ensuring that symptom severity did not affect eligibility for the study. However, patients scoring 6 or 7 on the CGI scale required careful consideration to ensure conscious consent for participation. In this study, HDRS and YMRS scores were pivotal in assessing symptom severity and corresponding states of BD.
During subsequent visits, patients were queried about any significant changes in their overall health and any other sudden life events that might have influenced their mood, activity, or behavior. Additionally, every two weeks patient’s mood statuses were evaluated assessed through telephone calls with the investigator, aimed at identifying any significant changes in mood and activity since the last contact. If such changes were detected, patients were scheduled for an intervention visit involving a comprehensive assessment using the HDRS and the YMRS. To streamline telephone assessments, patients answered questions from a standardized visit form (see Appendix 1).
The mental state, evaluated by HDRS and YMRS scores, was categorized into one of seven phases typical in the clinical course of bipolar disorder: mania, hypomania, balanced mood (euthymia), sub-depression, depression, severe depression, and mixed state. This classification was recorded as the CGI value and served as a label for the behavioral data provided by the patient during the evaluation date. In previous studies, researchers utilized various cut-off points on the HDRS and YMRS scales to train classifiers [18, 19, 30]. Higher thresholds, e.g., 13 points on the HDRS and YMRS, were employed to improve diagnostic accuracy by focusing on more severe symptoms [19].
This approach introduces a risk that milder symptoms of a particular phase may be categorized as euthymia. In this study, our objective was to detect early or initial symptoms of phase changes, prompting us to adopt lower cut-off points for classification:
euthymia: HDRS < 8 and YMRS < 6,
depression: HDRS ≥ 8 and YMRS < 6,
hypomania/mania: HDRS < 8 and YMRS ≥ 6,
mixed state: HDRS ≥ 8 and YMRS ≥ 6.
These criteria were selected to increase sensitivity in detecting phase transitions in bipolar disorder, allowing for the early capture of even milder symptoms in the assessment process.
Smartphones continuously collect behavioral data, whereas clinical assessments are conducted much less frequently. Training a predictive model requires both data types. To address this, psychiatric assessments were interpolated for periods when patients’ mental states were not evaluated. If there was no change in the CGI score between two consecutive visits, all days within that period were labeled with the CGI score assigned on the starting and ending days. Conversely, data obtained from intervals with different CGI scores were excluded from the training dataset.
Advanced analytical system
A high-level diagram illustrating the data acquisition and process workflow is shown below in Figure I.
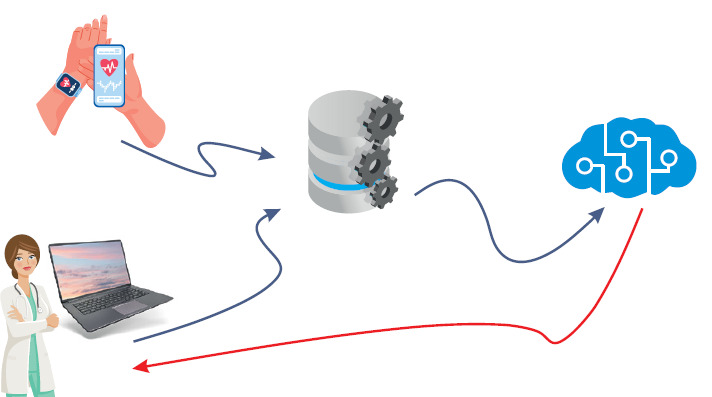
The collected data undergoes preprocessing to extract key behavioral parameters. Prior research has substantiated the influence of mood on voice characteristics [30-33]. The present study identified that physical voice metrics such as pitch, energy, and Mel cepstral coefficients are the most predictive parameters captured by the system. We identified 12 voice parameters with the highest predictive utility to monitor mood dynamics and anticipate impending changes.
Patients used the dedicated MoodMon application daily to provide voice samples by answering predetermined questions. These recordings were processed to extract essential acoustic parameters. These parameters, along with supplementary data such as seasonality and gender, were analyzed by proprietary AI models at both aggregate (population-wide) and individual levels. This enabled predictions of potential mood shifts and facilitated decisions regarding alert issuance. CGI values provided by psychiatrists during alert assessments were further leveraged to refine and recalibrate the predictive models ensuring the models remained responsive to the evolving clinical status of each patient.
The clinical study was conducted in two distinct phases. In the initial phase (August 2021 – July 2022), the system focused on data collection to identify optimal monitoring parameters and effective AI models, which were then trained to alert healthcare providers to potential changes in patient conditions. In August 2022, the study entered its second phase, during which an advanced alert mechanism was implemented. The system began predicting mood changes, and these predictions were evaluated for accuracy using CGI scores and personalized assessments by psychiatrists. Evaluations also accounted for non-BD factors that could influence the patient’s mood and activity, based on information gathered during medical or telephone visits prompted by system alerts.
Evaluation of alert justifications allows for the calculation of key success metrics, notably the true positive rate (TPR) – sensitivity, and the true negative rate (TNR) – specificity. These metrics play a key role in assessing the effectiveness of the system.
The alert mechanism introduced in the second phase of the project is a particularly innovative aspect of the system. This feature signals potential transitions in the patient’s medical phase, allowing for preemptive healthcare interventions.
In practical application, upon activation of an alert, the attending physician receives a notification. This allows the physician to conduct a thorough evaluation, considering not only the current state of the patient but also the relevance and urgency of the alert. A significant aspect of this evaluation is the integration of the physician’s subjective judgment in response to alerts, which adds human insight to the automated system. It is important to emphasize that the system does not indicate the direction of change in the patient’s condition and alerts may arise from factors unrelated to the disease. The final diagnosis and decision on any necessary actions remain the clinician’s responsibility.
Assessment of the alert-sending system
The effectiveness of the MoodMon system in the second phase of the project was assessed using two performance indicators:
TPR (true positive rate) – an indicator of correctly predicted mood changes,
TNR (true negative rate) – an indicator of correctly predicted lack of changes,
where the values of tp, tn, fp, and fn are individual labels for each day of all patients under observation:
tp – true positive = alert issued and evaluated as justified (mood change occurred since previous clinical evaluation of the patient),
tn – true negative = no alert and its lack evaluated as correct (no mood change since the previous clinical evaluation of the patient),
fp – false positive = alert sent but evaluated as not justified (no mood change since the previous clinical evaluation of the patient),
fn – no alert and decision evaluated as incorrect (mood change occurred since previous clinical evaluation of the patient).
These labels were assigned as follows.
Each day where an alert was sent can be evaluated with a value of tp or fp.
Two labels tn and fn were assigned when the alert was not issued.
The objective was to maximize the probability of tp and minimize tn, even if it meant accepting a higher number of false alarms (fp). Diagrams illustrating the label assignment process are shown as Figure II (related to days with an alert) and Figure III (related to days without an alert).
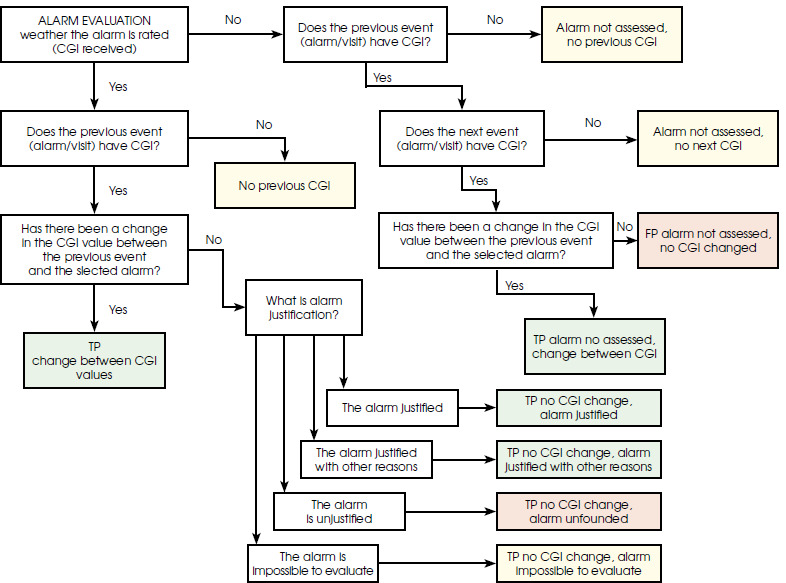
The first scheme applies specifically to the days on which an alert was sent. The initial step involves verifying the completion of the CGI scale to assess any changes in the patient’s condition compared to the previous CGI value. If the CGI scale is completed and indicates a change, the alert is labeled as TP. If there is no change in the CGI, the subjective evaluation provided by the psychiatrist for each alert is considered. Based on this evaluation, the alert may also be labeled as tp, if justified according to the psychiatrist’s subjective opinion. Additionally, it is noted that it was not possible to evaluate the alert due to the lack of contact with the patient within a reasonable timeframe since the alert was issued.
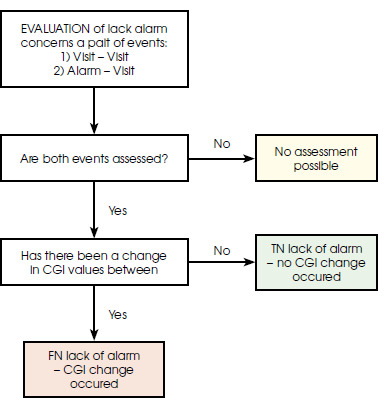
The second schema is applied to label the days on which no alert was sent. These are the days between two consecutive events: either between visits or between an alert and a visit. Initially, the entire period between these events is evaluated, as illustrated in Figure III.
If there is no change in the CGI, the tn label is assigned to all days within the period. If there is a change in the CGI, the fn label is assigned to only one day within the period between the two events under consideration. The remaining days are labeled as tn.
Once all days of all patients under observation are labeled, it becomes possible to calculate the performance metrics of the system (TPR and TNR).
Patient population
The clinical study included a population of 75 patients diagnosed with bipolar disorder. Table 2 presents the distribution of age, gender, and other demographic information for the participants.
Table 2
The distribution of demographic data of the patients participating in the clinical study (N = 75)
The effectiveness of the alert-sending system and the impact of patients’ active participation were assessed based on the counts of labels assigned to the days observed.
The system’s effectiveness was evaluated on two levels:
Using counts of all labels for all days of all patients the overall system efficiency indicators were as presented in Table 3.
TPR equal to 86.6% and TNR equal to 98.59% are satisfactory and promising.
Using counts of all labels for all days of each single patient the system efficiency indicators we calculated per patient as shown in Table 4 for several selected patients.
Table 4
Individual effectiveness indicators for selected patients
| Patient ID | TPR | TNR |
|---|---|---|
| 31 | 97.05% | 97.21% |
| 02 | 90.00% | 98.85% |
| 36 | 86.11% | 97.74% |
| 46 | 80.00% | 99.04% |
| 06 | 70.37% | 99.06% |
Individual effectiveness indicators can vary significantly. Specifically, the TPR may be too low to be satisfactory, leading to a high number of false positive alerts. This situation results in the unnecessary involvement of scarce medical staff.
The study investigated the dependence of system effectiveness on various factors and observed a strong correlation with patient activity. Overall system effectiveness was assessed by considering only those patients who provided at least 30% and 50% of the expected number of voice recordings. In both cases, there was a notable reduction in days labeled as fn (false negative). This resulted in an increase in TPR by 7.25% and 8.78% respectively, while TNR remained unaffected, as shown in Table 5.
Table 5
TPR and TNR results for three sets of data: full set, comprised of records with at least 30% or expected recordings, and comprised of records with at least 50% of recordings
| Indicator | Entire set of available data | At least 30% of recordings | At least 50% of recordings |
|---|---|---|---|
| TPR | 86.60% | 93.85% | 95.38% |
| TNR | 98.59% | 98.60% | 98.60% |
Similarly, Table 6 presents the outcomes for the pre- selected cohort of 5 patients, comparing the number of observation days evaluated at 100%, 30%, and 50% of expected recordings. Simulating varied recording frequencies across these patients demonstrated a notable improvement in the TPR indicator by as much as 15%. The final two columns of Table 6 highlight the actual percentage of recordings acquired from each patient during the trial phases, underscoring the significant impact of patient engagement on the system’s operational effectiveness.
Table 6
Selected patients’ results showed TPR and TNR dependence on the frequency of the recording of the voice sample
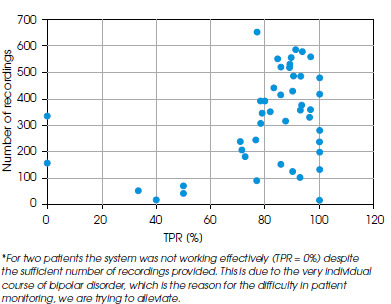
The calculations shown above were conducted for all participants in the trial. Figure IV illustrates the individual TPR values per patient, alongside the corresponding number of recordings. This graph highlights a clear correlation between these variables, indicating a strong dependency between them.
DISCUSSION
Patients with BD, alongside their doctors and psychologists, are increasingly shifting away from traditional analog methods of condition monitoring – such as surveys and paper forms – in favor of technologically advanced mobile applications. Clinical studies support this transition, indicating that patients often misplace paper cards but are less likely to lose their phones with installed applications. Furthermore, patients generally find mobile applications less tedious compared to traditional methods [14].
Literature also highlights a growing interest among patients with BD in utilizing mobile applications or wearable sensors, a trend that is particularly crucial in light of the ongoing shortages of medical staff [11].
Concurrently, there is a recognized need to enhance mobile applications through active participation from both patients – focused on improving user-friendliness and ease of use – and clinicians who can provide their expertise in BD treatment. This collaboration aims to empower patients to utilize smartphone monitoring applications effectively in achieving stable mental health. However, the existing literature reveals a significant gap in understanding the positive impact of patients’ active engagement in transmitting data to these applications on their operational effectiveness. Consequently, there are few objective incentives prompting patients to consistently use the application by submitting objective voice data [12, 13].
In this study, we demonstrated and proved that patient involvement through the submission of voice samples enhances the accuracy and efficacy of assessing changes in the mental status of patients with BD. These changes can arise from the disorder itself or from external factors in the patient’s life that psychiatrists must consider, such as travel-induced sleep deprivation, infectious diseases, or significant interpersonal conflicts. Notably, maintaining a high frequency of voice sample submissions to the MoodMon monitoring system was found to significantly improve the precision of triggering clinically justified alerts.
Previous studies have highlighted the fact that patients using applications report increased satisfaction when prompted to actively transmit data, although forgetting to send data remains a common challenge among respondents [12]. In various research domains, efforts have been made to enhance applications and monitoring systems by implementing reminders for systematic recordings. For instance, SMS reminders are employed to encourage patients to transfer data promptly and engage actively with notifications and other information provided by the application [14]. In the MoodMon study, the reminders for voice recordings, prompting responses to three questions, played a crucial role.
Our study is pioneering in demonstrating that systematic, patient-initiated voice data transfer enhances health monitoring efficacy in patients with BD. To our knowledge, no other studies have explored this area.
The findings of the present study offer optimism that patients’ understanding of how their active involvement can improve the effectiveness of bipolar disorder monitoring will lead to better disease management. This underscores the ongoing importance of psychoeducation in this context, particularly for individuals with mental disorders like BD, who may face greater challenges in maintaining motivation and consistency, compared to those with other chronic illnesses.
According to the exit survey conducted in our clinical trial, 62% of the respondents highlighted the benefits of using the MoodMon system. The most commonly reported advantages were:
increased frequency, regularity, and improved communication with psychiatrists (27%),
perception of better and consistent health monitoring (20%),
feeling of support and improved care (3%).
Additionally, 66% of the respondents stated that the application had a neutral impact on their mental state, while 20% reported a positive impact. Only 3% indicated a mildly negative impact, and 1% felt it had a negative impact.
These results underscore the potential of digital health technologies to enhance patient engagement and satisfaction, thereby contributing to more effective management of bipolar disorder.
CONCLUSIONS
A notable enhancement in the system’s effectiveness metrics was observed, as patients intensified their participation and consistently supplied actively obtained objective monitoring data.
The study demonstrates patients’ acceptance of the monitoring approach. However, there is a clear need for thorough analysis from both the psychiatrists’ and patients’ perspectives, particularly given the limited focus on patient viewpoints amid the growing volume of AI studies in psychiatry.