Summary
In our study, we aimed to investigate the relationship and prognostic value of the shock index (SI), modified shock index (MSI) and age-adjusted shock index (ASI) with spontaneous echo contrast (SEC) formation in patients with heart failure with reduced ejection fraction (HFrEF). Between September 2017 and September 2022, 584 patients with left ventricular ejection fraction (LVEF) ≤ 40 and appearance of SEC within the left ventricular cavity were examined. The main results obtained in our study were as follows: a) There was a significant relationship between SEC image and SI, MSI and ASI in HFrEF patients. b) Mortality, ischemic cerebrovascular occlusion (CVO) and cumulative event rate were significantly higher in the patient group with HFrEF and SEC images. c) SEC and ASI were independent predictors of mortality and ischemic CVO in the HFrEF patient group during the 1-year follow-up period.
Introduction
Heart failure (HF) patients are known to have a prothrombotic state and impaired coagulation system. All three components of the Virchow triad (endothelial dysfunction, stasis, and hypercoagulability) are altered in HF, especially in the decompensated state [1]. Approximately 1/3 of HF patients have indolent disease, defined as evidence of neuronal damage without clinically evident stroke or transient ischemic attack. There are magnetic resonance imaging studies showing brain infarcts [2, 3]. Spontaneous echo contrast (SEC) is the swirling “smoke-like” appearance detected in the heart chambers as a result of decreased flow velocity in the cavity [4]. Among the most common causes of SEC are dilated cardiomyopathy (DCMP), atrial fibrillation, impaired myocardial contractility, and dyskinetic segments of the left ventricle. In addition, the relationship of SEC with embolic events increases its clinical importance. In studies, the prevalence of SEC varies between 16% and 84% in patients who develop cerebral embolism or peripheral embolism [5, 6]. The shock index (SI), defined as heart rate (HR) divided by systolic blood pressure (SBP), was first used in 1967 to determine the hemodynamic stability of patients [7]. Modified SI (MSI) is defined as HR divided by mean arterial blood pressure (MABP). It has been investigated whether these indices are useful tools for early risk stratification in some diseases [8]. It has also been shown that high SI is associated with in-hospital mortality and major adverse cardiac events (MACEs) in myocardial infarction patients [9, 10]. While high SI is associated with hypovolemia, a lower SI may have prognostic significance in stroke as an indicator of severe neurological stress [11]. Aging is often accompanied by increased risk of morbidity and mortality. The age-adjusted shock index (ASI) is another recently introduced index that may be practical in predicting mortality [12]. It is defined as age in years multiplied by the SI [13]. In one study, SI, MSI, and ASI were associated with in-hospital mortality in acutely decompensated HF patients [14]. It is conceivable that SI, which is considered an indicator of hypovolemia, may play a role in the formation of SEC in patients with HF with reduced ejection fraction (HFrEF) through the effects of stasis and coagulation factors. This condition may also be an inducer of cerebrovascular events and mortality. Additionally, the predictive value of MSI and ASI may be higher. Our information on this subject is not clear.
Aim
In our study, we aimed to investigate the relationship and prognostic value of SI, MSI and ASI with SEC formation in HFrEF patients.
Material and methods
Study design
We conducted our research retrospectively. We included patients from two different centers in our study. Between September 2017 and September 2022, 584 patients with left ventricular ejection fraction (LVEF) ≤ 40 and appearance of SEC within the left ventricular cavity were examined. Exclusion criteria: atrial fibrillation/flutter, prosthetic heart valves, patients with atrial septal defect and ventricular septal defect, anticoagulation drug use, moderate-severe heart valve stenosis, hemodialysis patients, severe liver dysfunction, decompensated heart failure, hemodynamic instability, active infection, malignancies, chronic inflammatory diseases, hematological diseases and thyroid diseases. After excluding patients who did not meet the study criteria, 537 patients were included in our study. Patients or their representatives were informed about the study verbally and in writing. The study protocol was conducted in accordance with the 2013 Declaration of Helsinki.
Transthoracic echocardiography and spontaneous echo contrast
Transthoracic echocardiography (TTE) GE Vivid 5 (5-1 MHz multi-frequency probe, GE Medical Systems, Milwaukee, USA) examinations and measurements were performed according to the recommendations of the American Society of Echocardiography [15]. Images and measurements were reviewed by an independent cardiologist at our center. Left ventricular end-diastolic diameter (LVEDD), left ventricular end-systolic diameter (LVESD), septal wall thickness (IVSd), and posterior wall thickness (LVPWd) were measured from the parasternal M-mode view according to standard criteria. Left atrial (LA) diameter was measured in a two-dimensional projection of ventricular end-systole in the parasternal long-axis view. LVEF was determined from apical images with the modified Simpson’s rule. SEC was identified if dynamic “smoke-like” echos with swirling motion in the cavity were seen. In our study, we included patients in whom we detected SEC in the left atrium. SEC was classified according to Fatkin into five categories, from 0 to 4+ [4] level 0 indicating absence of echogenicity; level 1 indicating mild SEC (minimal echogenicity only transiently detectable with optimal gain settings during the cardiac cycle); level 2 indicating mild-to-moderate SEC (transient SEC without increased gain settings and a denser pattern than 1+); level 3 indicating moderate SEC (dense swirling pattern throughout the cardiac cycle); and level 4 indicating severe SEC (intense echodensity and very slow swirling patterns) [16].
Definitions
A detailed medical history was taken from all patients at the time of admission. Hypertension (HT) was defined as systolic blood pressure (SBP) ≥ 140 mm Hg and/or diastolic blood pressure (DBP) ≥ 90 mm Hg and/or use of antihypertensive medication. Diabetes mellitus (DM) was defined as a fasting glucose level of 126 mg/dl or use of antidiabetic agents or HbA1c > 7%. Dyslipidemia was defined as a total cholesterol level > 200 mg/dl or a low-density lipoprotein (LDL) level > 130 mg/dl. Smoking was defined as current cigarette smoking. Ischemic cerebrovascular occlusion (CVO) was defined as a focal neurological deficit of sudden origin due to presumed arterial occlusion persisting for more than 24 h and without evidence of primary hemorrhage on neuroimaging; if lasting fewer than 24 h, neuroimaging evidence of brain infarction must have been present [17]. The following formulae were used to calculate shock indices for each patient: SI (HR/SBP), MSI (HR/MABP), ASI (age × SI).
Follow-up and study outcomes
Demographic and clinical characteristics, including age, gender, follow-up period, clinical outcomes, and relevant laboratory values, were obtained from hospital records. The primary endpoint included each component of ischemic CVO and mortality. The secondary endpoint was considered cumulative events, which included the combination of ischemic CVO and mortality.
Statistical analysis
Data were analyzed using SPSS for Windows version 25.0 (Armonk, NY, USA: IBM Corp.). The Kolmogorov-Smirnov test was used to evaluate the normal distribution of continuous variables. Continuous variables were expressed as mean ± standard deviation (SD) and were compared using Student’s t-test. Categorical variables were expressed as percentages and were compared using the χ2 test or Fisher-Freeman-Halton test as appropriate. Univariate and multivariate Cox regression analysis was performed for predictors of mortality and cerebrovascular occlusion. The relationship of SI, MSI, and ASI parameters with SEC was evaluated by receiver operating characteristic (ROC) curve analysis. The obtained cut-off values, area under the curve (AUC), sensitivity, specificity, confidence interval and p-values were recorded. Variables with a p-value of < 0.05 were considered significant.
Results
A total of 537 patients were included in the study. They were divided into two groups: 146 patients with SEC and 391 patients without SEC.
Patient characteristics
The average age of the patients included in the study was 64.2 ±9.4 years, and there was no significant difference between the groups (65.3 ±8.2 vs. 63.8 ±9.8, respectively, p = 0.067). 54.7% of the patients included in the study were male, and there was no significant difference between the groups in terms of male gender (58.9% vs. 53.2%, respectively, p = 0.237). Diabetes mellitus (DM) (30.8% vs. 19.9%, respectively, p = 0.008), coronary artery disease (CAD) (69.2% vs. 56.8%, respectively, p = 0.009) and chronic kidney disease (CKD) (33.6% vs. 23.3%, respectively, p = 0.016), and pulmonary artery pressure (32.2 ±8.5 vs. 29.3 ±7.4, p < 0.001, respectively) were significantly higher in the SEC group. There was no significant difference between the groups in terms of LVEF (27.8 ±7.5 vs. 28.2 ±7.2, respectively, p = 0.569) (Table I). Other demographic, clinical features and echocardiographic parameters of the patients are summarized in Table I.
Table I
Comparison of demographic, clinical and echocardiographic parameters of the groups
Albumin (3.46 ±0.97 vs. 3.68 ±0.92, respectively, p = 0.017) and hemoglobin (11.4 ±1.9 vs. 11.9 ±1.7, respectively, p = 0.003) were significantly lower in the SEC group (Table II). Other laboratory parameters of the patients are summarized in Table II.
Table II
Comparison of laboratory parameters of groups
Spontaneous echo contrast and shock indexes
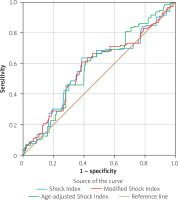
SI (0.65 ±0.15 vs. 0.61 ±0.14, respectively, p = 0.014), MSI (0.92 ±0.22 vs. 0.87 ±0.20, respectively, p = 0.007) and ASI (42.76 ±11.71 vs. 39.83 ±12.25, respectively, p = 0.013) were significantly higher in the SEC group (Table III). In the ROC analysis, SI with 64% sensitivity, 61% specificity (cut-off: 0.63, AUC = 0.573, 95% CI: 0.517–0.629, p = 0.009), MSI with 61% sensitivity, 61% specificity (cut-off: 0.90, AUC = 0.574, 95% CI: 0.519–0.630, p = 0.008), and ASI with 62% sensitivity, 59% specificity (cut-off: 39.44, AUC = 0.577, 95% CI: 0.524–0.630, p = 0.006) were associated with SEC (Figure 1).
Table III
Comparison of shock indexes and end points of groups
Clinical endpoints
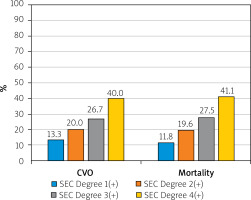
Ischemic CVO (10.3% vs. 3.3%, respectively, p = 0.001) and mortality (34.9% vs. 24.6%, respectively, p = 0.016) rates were significantly higher in the SEC group. Additionally, the cumulative rate of mortality and ischemic CVO (secondary endpoint) (39.7% vs. 26.1%, p = 0.002) was significantly higher in the SEC group (Table III). The distribution of patients according to degree of SEC is shown in Table III.
We performed univariate and multivariate Cox regression analysis to determine the predictors of mortality after 1 year of follow-up. DM (OR = 0.358, 95% CI: 0.201–0.640, p = 0.001), CAD (OR = 0.288, 95% CI: 0.190–0.436, p < 0.001), CKD (OR = 5.478, 95% CI: 3.672–8.173, p < 0.001), moderate-severe tricuspid regurgitation (OR = 0.288, 95% CI: 0.169–0.490, p < 0.001), SEC (OR = 1.559, 95% CI: 1.075–2.262, p = 0.019) and ASI were found (OR = 1.044, 95% CI: 1.032–1.057, p < 0.001) to be independent predictors of mortality (Table IV).
Table IV
Independent predictors of mortality in univariate and multivariate Cox regression analysis model in 1-year follow-up period
Additionally, we applied univariate and multivariate Cox regression analysis to determine the predictors of ischemic CVO developing after 1 year of follow-up. We found that SEC (OR = 2.822, 95% CI: 1.328–5.998, p = 0.007) and ASI (OR = 1.034, 95% CI: 1.002–1.066, p = 0.038) were independent predictors for ischemic CVO (Table V).
Table V
Independent predictors of cerebrovascular occlusion in univariate and multivariate Cox regression analysis model in 1-year follow-up period
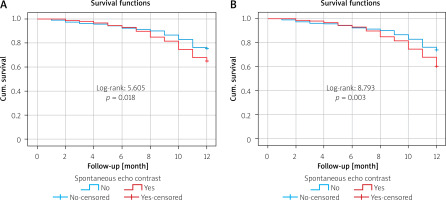
The relationship between SEC and mortality and cumulative events during the 1-year follow-up period was evaluated with Kaplan-Meier analysis. A significant relationship was detected between SEC and mortality (log-rank: 5.605, p = 0.018, Figure 2 A) and between SEC and cumulative events (log-rank: 8.793, p = 0.003, Figure 2 B). In addition, the percentage (%) distributions according to the degree of SEC in the patient group with ischemic CVO and mortality are shown in Figure 3.
Discussion
The main results obtained in our study were as follows: a) There was a significant relationship between SEC image and SI, MSI and ASI in HFrEF patients. b) Mortality, ischemic CVO and cumulative event rate were significantly higher in the patient group with HFrEF and SEC images. c) SEC and ASI were independent predictors of mortality and ischemic CVO in the HFrEF patient group during the 1-year follow-up period. Studies have shown that HF is a prothrombotic disease [18, 19]. Blood stasis due to dilated chambers and low output, altered neurohormonal mechanisms, and endothelial dysfunction are factors that lead to platelet aggregates and increased thrombin activation [20]. The prevalence of SEC in the population undergoing random transesophageal echocardiography varies between 3% and 20% [4]. In smaller series of patients with sinus rhythm and DCMP, the frequency of SEC in the left heart chambers has been reported to be higher [21]. Siostrzonek et al. reported that 33% of patients with idiopathic DCMP had SEC in the left atrium, while Shen et al. observed SEC in 42% of 86 patients with DCMP [22, 23]. Additionally, Kozdağ et al. found that silent cerebral infarction was a common finding in patients with DCMP and that moderate-to-severe left atrial SEC was an important contributing factor [24]. In one large study, 21% of stroke patients in sinus rhythm with reduced left ventricular function was observed to have SEC [25]. Handke et al. reported that in the cerebral ischemic patient population, 31% of patients with SEC detected in the left atrium were in sinus rhythm, and an additional 9% were in sinus rhythm but experienced paroxysmal atrial fibrillation attacks [26].
Sympathetic overactivity is associated with increased heart rate, increased blood pressure, and increased catecholamine levels [27]. On the other hand, vagal stimulation is associated with a decrease in heart rate and blood pressure [28]. There are complex and deep connections between autonomic nervous system dysfunction and the development of acute CVO [29]. Autonomic nerve system imbalance can lead to the development of risk factors such as hypertension, DM, CAD and atrial fibrillation. The development of these risk factors causes an imbalance in prothrombotic and pro-inflammatory endothelial functions, leading to the development of acute CVO [30]. In our study, DM, CAD and CKD were significantly higher in the group with SEC. Our hypoalbuminemia and anemia rates were higher in the group with SEC secondary to CKD. Current evidence shows that the negative effects of autonomic instability in patients with acute CVO are due to excessive sympathetic activation and decreased vagal tone [31]. In our study, in line with the data reported in the literature, we found the ischemic CVO and mortality rates to be higher in the SEC group.
In the early phase of acute ischemic CVO, approximately two-thirds of patients have an acute hypertensive response characterized by an increase in systolic and diastolic blood pressure and an increase in heart rate [32]. Heart rate and blood pressure are important variables in predicting acute stroke outcome. Therefore, it has been shown that SI calculated by the ratio of these two parameters may be a better predictor of poor prognosis in ischemic CVO [33]. Previous studies have shown that increased SI and MSI are associated with poor prognosis and death in acute trauma patients, intensive care patients, and acute myocardial infarction [34, 35]. Additionally, increased SI in ischemic CVO patients has been shown to be associated with short- and long-term mortality [33].
SI and MSI have been associated with in-hospital mortality in STEMI patients undergoing percutaneous coronary intervention [36]. Additionally, SI has been found to predict stroke-related clinical outcomes and post-stroke mortality [11, 33]. Studies on SI, MSI and ASI mostly included acute patients. In our study, which is the first such study in the literature to the best of our knowledge, we examined the effect of these indices on stable HFrEF patients with SEC. We believe that the results we obtained will make a significant contribution to the literature from the diagnosis stage to the follow-up process.
Limitations: Our study had some limitations as well as its strengths and unique aspects. Our study was designed retrospectively and included a relatively small number of patients. The results of the study can be generalized by conducting a longer follow-up in a larger population. Because we planned retrospectively, we could not clearly distinguish whether CVO was ischemic, cryptogenic, or embolic. We had no information about some cardiovascular drugs, such as catecholamines, which strongly affect blood pressure and thus SI, MSI and ASI. We did not find out about all medications used by patients or examine patients with transesophageal echocardiography. We did not obtain a detailed insight into the left atrial appendage. This may have had an impact on mortality and ischemic CVO. Paroxysmal atrial fibrillation attacks could not be completely excluded by Holter monitoring. We included only white race patients in our study, so the study results cannot be generalized to all races. In addition, we obtained all data and follow-up data of the patients from the hospital registry system and the national data registry system. We could not exclude possible errors in the results.
Conclusions
The presence of SEC in the HFrEF patient group is an effective predictor of the development of ischemic CVO and mortality. SI, MSI and ASI may be quickly accessible and calculable indices to predict SEC in HFrEF patients. The practical use of these indices can be a guide in the follow-up process. In order to generalize the study results, multicenter studies with national and international participation are needed.


