

Introduction
Hematopoietic stem (HSCs) and hematopoietic progenitor cells (HPCs) are responsible for the regeneration and maintenance of all blood cells. HSCs differentiate into multipotent progenitors (MPPs), which have limited self-renewal ability. MPPs then differentiate into common myeloid progenitors (CMPs) and common lymphoid progenitors (CLPs). CMPs give rise to bipotent granulocyte-macrophage progenitors (GMPs) and megakaryocyte-erythrocyte progenitors (MEPs), while CLPs differentiate into T cells, B cells, natural killer (NK) cells, and dendritic cells. GMPs further differentiate into granulocytes and monocytes, and MEPs generate megakaryocytes and erythrocytes [1]. Given the pivotal role of HSCs and HPCs in the host’s defense response, their proliferation and differentiation are crucial during viral and bacterial infections. However, a dysregulated HSC and HPC response can be damaging to the host’s defense against infection [2, 3]. Dysregulation of HSCs and HPCs has been linked to many viral infections. Various viruses including herpesvirus, hepatitis C virus (HCV), and human immunodeficiency virus (HIV) have been shown to target HSC to promote infection and associated diseases [4, 5].
The immune response is one of the most important determinants of the disease presentation and severity in SARS-CoV-2 infected patients [6, 7]. Usually, severely ill COVID-19 patients exhibit dysfunctions and dysregulation of lymphoid and myeloid compartments. Lymphopenia and dysfunction of T cells, B cells, monocytes, dendritic cells (DCs), and natural killer cells (NKs) have been well documented in severe COVID-19 patients. Moreover, these patients are marked by dysregulation of inflammatory cytokines and cytokine storm, which may cause multiple organ failure and death [8-10].
The mechanism behind the pathology of the immune system in the context of COVID-19 is yet to be fully understood. HSCs and HPCs in peripheral blood (PB) are readily accessible and considered important biomarkers for monitoring deficiencies in the immune response. Few studies have been dedicated to investigating the contribution of HSCs and HPCs to COVID-19-associated immune dysfunction. To this end, the current study aimed to precisely monitor the kinetics and contribution of HSCs and HPCs in severe and non-severe COVID-19 and evaluate their diagnostic performances.
Material and methods
Patients and subjects
COVID-19 patients admitted to the University Hospital at Al-Azhar University, Assiut with a confirmed SARS-CoV-2 positive result were approached for participation. The diagnosis of COVID-19 was based primarily on reverse-transcription polymerase chain reaction (RT-PCR) on throat swabs. Patients were subjected to detailed medical history and clinical examinations. Recovered COVID-19 patients and healthy donors were recruited and invited to participate. All healthy controls were clinically free and showed no evidence of infection by history, clinical examination, and complete blood counting (CBC). None of the controls had a history of close contact with a COVID-19-positive patient in the two weeks preceding the sample collection. Informed consent forms have been signed by participants or their surrogates.
Sample collection and clinical examination
Peripheral blood samples were collected from 48 COVID-19 patients, 16 recovered, and 27 healthy controls. Laboratory tests, including CBC and COVID-19 related tests such as D-dimer, ferritin, and C-reactive protein (CRP) were done for all patients.
Flow cytometric detection of hematopoietic stem cells and progenitor cells
Specimens
Freshly collected PB samples were used for flow cytometry assay [11]. A blood sample of at least 1 ml should be withdrawn or until the specified level on the EDTA tube. Peripheral blood mononuclear cells (PBMCs) were separated by Ficoll density gradient centrifugation (Bio-west, Riverside, MO).
Instruments and software
Flow cytometry data were acquired on a BD FACSCanto II analyzer equipped with three lasers. The instrument was set up using BD Cytometer Setup and Tracking (CS&T) beads. BD FACSDiva software (v6.1.3) was used for data acquisition and analysis. Application settings were established to optimize the cytometer’s photomultiplier tube (PMT) voltages [12].
Sample staining
Antibody reagent cocktails were made in 5 ml round-bottom tubes, immediately prior to use, as specified in Table 1. One hundred microliters of cells separated (approximately 1 × 10⁶ cells) in phosphate-buffered saline (PBS) were added. Tubes were incubated for 20 minutes in the dark at room temperature. Red blood cells (RBCs) were lysed by adding 1 ml of 1X BD Pharm Lyse lysing buffer to each tube followed by 10 minutes of incubation in the dark at room temperature. Acquisition and analysis were done using a FACSCanto flow cytometry (Becton Dickinson Biosciences, San Jose, California USA). One hundred thousand events were analyzed, and an isotype-matched negative control was used with each sample [12].
Data analysis
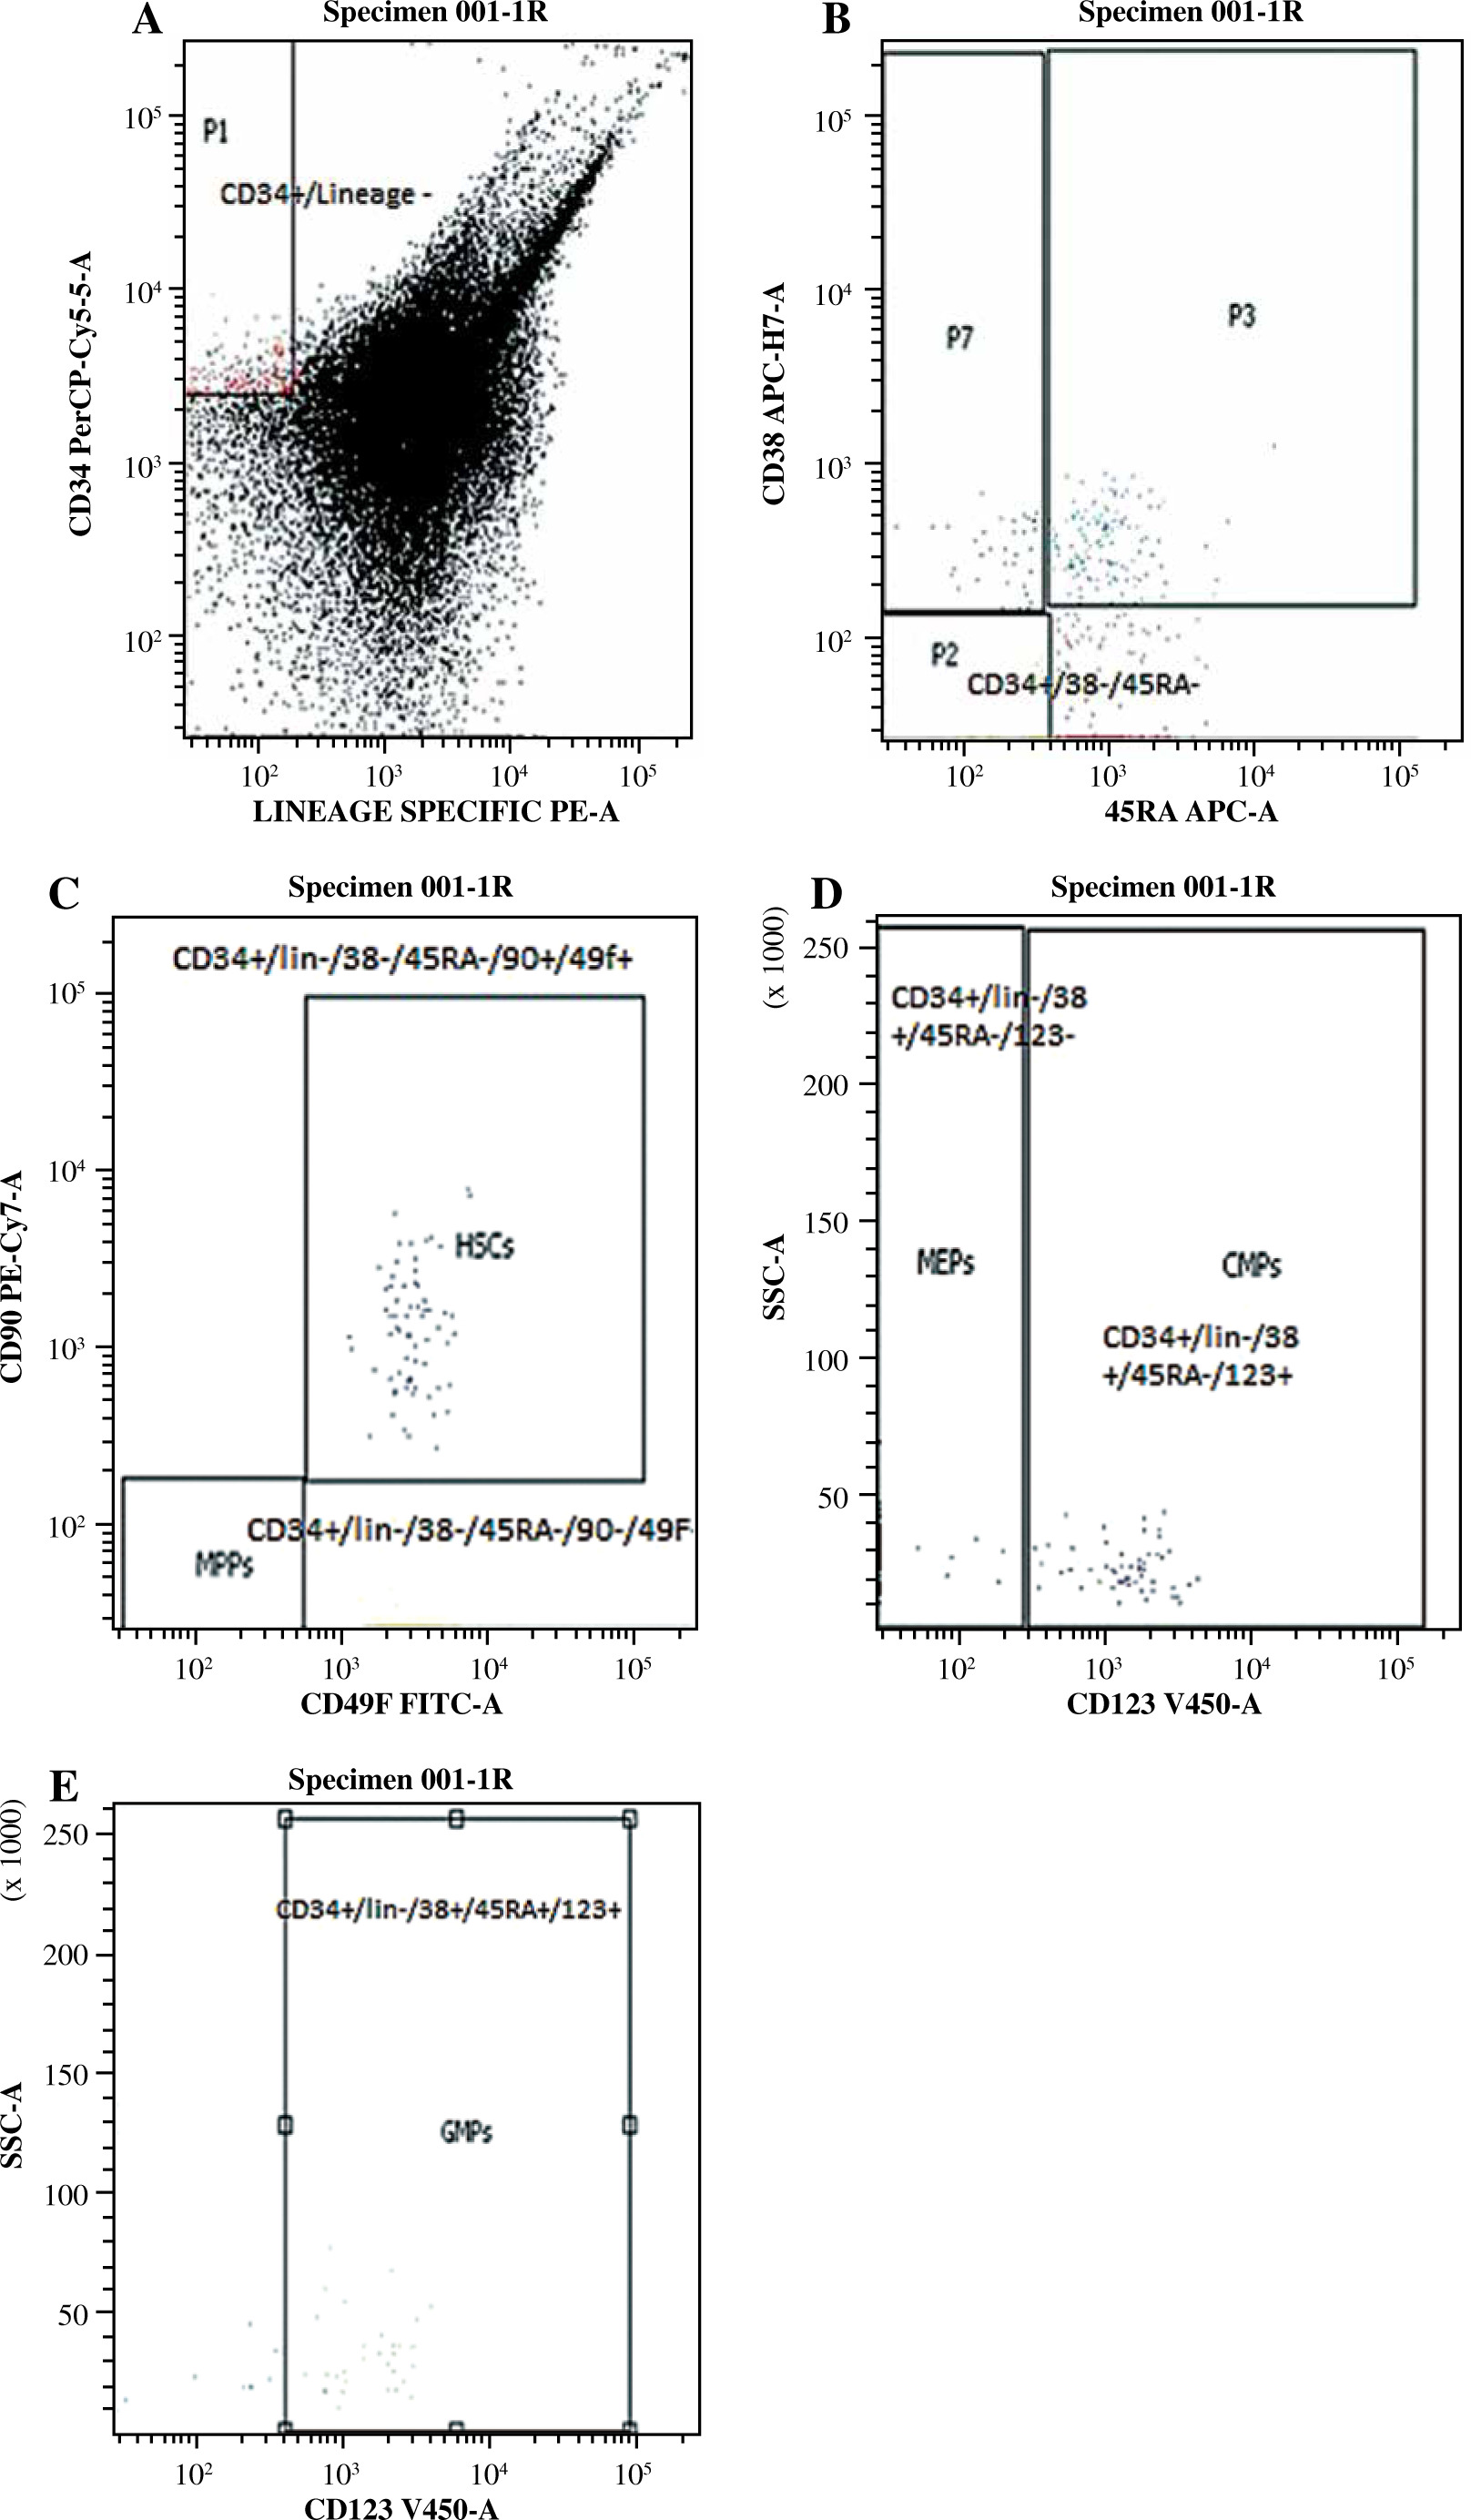
Analysis was done using a sequential gating strategy where the first gating involves the CD34+/lineage (CD3/19/33/14)– population and the subsequent gating population as illustrated in Table 2 and Figure 1.
Table 2
Combination of surface markers used to separate hematopoietic stem cells (HSCs) and hematopoietic progenitor cells (HPCs)
| Cells | Markers | References |
|---|---|---|
| Hematopoietic stem cells (HSCs) | Lin(CD3/19/33/14)-CD34+CD38-CD90+CD45RA–CD49f+ | [10-14] |
| Multipotential progenitors (MPPs) | Lin(CD3/19/33/14)-CD34+CD38-CD90-CD45RA–CD49f– | |
| Common myeloid progenitors (CMPs) | Lin(CD3/19/33/14)-CD34+CD38+CD123+CD45RA– | |
| Megakaryocyte-erythroid progenitors (MEPs) | Lin(CD3/19/33/14)-CD34+CD38+CD123–CD45RA– | |
| Granulocyte-macrophage progenitors (GMPs) | Lin(CD3/19/33/14)-CD34+CD38+CD123+CD45RA+ |
Fig. 1
Gating strategy of HSCs and their subpopulations. A) Gating on CD34+/lin(CD3/19/33/14)– population. B) CD34+/lin(CD3/19/33/14)– populations were further gated on CD38 and CD45RA expression. C) Within CD34+/lin(CD3/19/33/14)– CD38–CD45RA– population, CD90+CD49f+ expression defined HSCs and CD90–CD49f– expression defined MPPs. D) CD34+/ lin(CD3/19/33/14)– CD38+CD45RA– population were further subdivided into CD45RA– CD123+ (CMPs), and CD45RA– CD123– (MEPs) compartments. E) Within the CD34+/lin(CD3/19/33/14)–CD38+CD45RA+ population, CD123+ expression defined the GMP compartment
Statistical analysis
IBM SPSS Statistics (version 20) and Prism (GraphPad Software, version 8) were used for the statistical analysis. Categorical data were presented as percentages, while quantitative data were expressed as the mean ± standard error. One-way ANOVA and Student’s t-test were used to compare between groups, and Spearman rank-order correlation was employed to evaluate the association between different variables. P values < 0.05 were considered statistically significant.
Results
The main features of COVID-19 patients
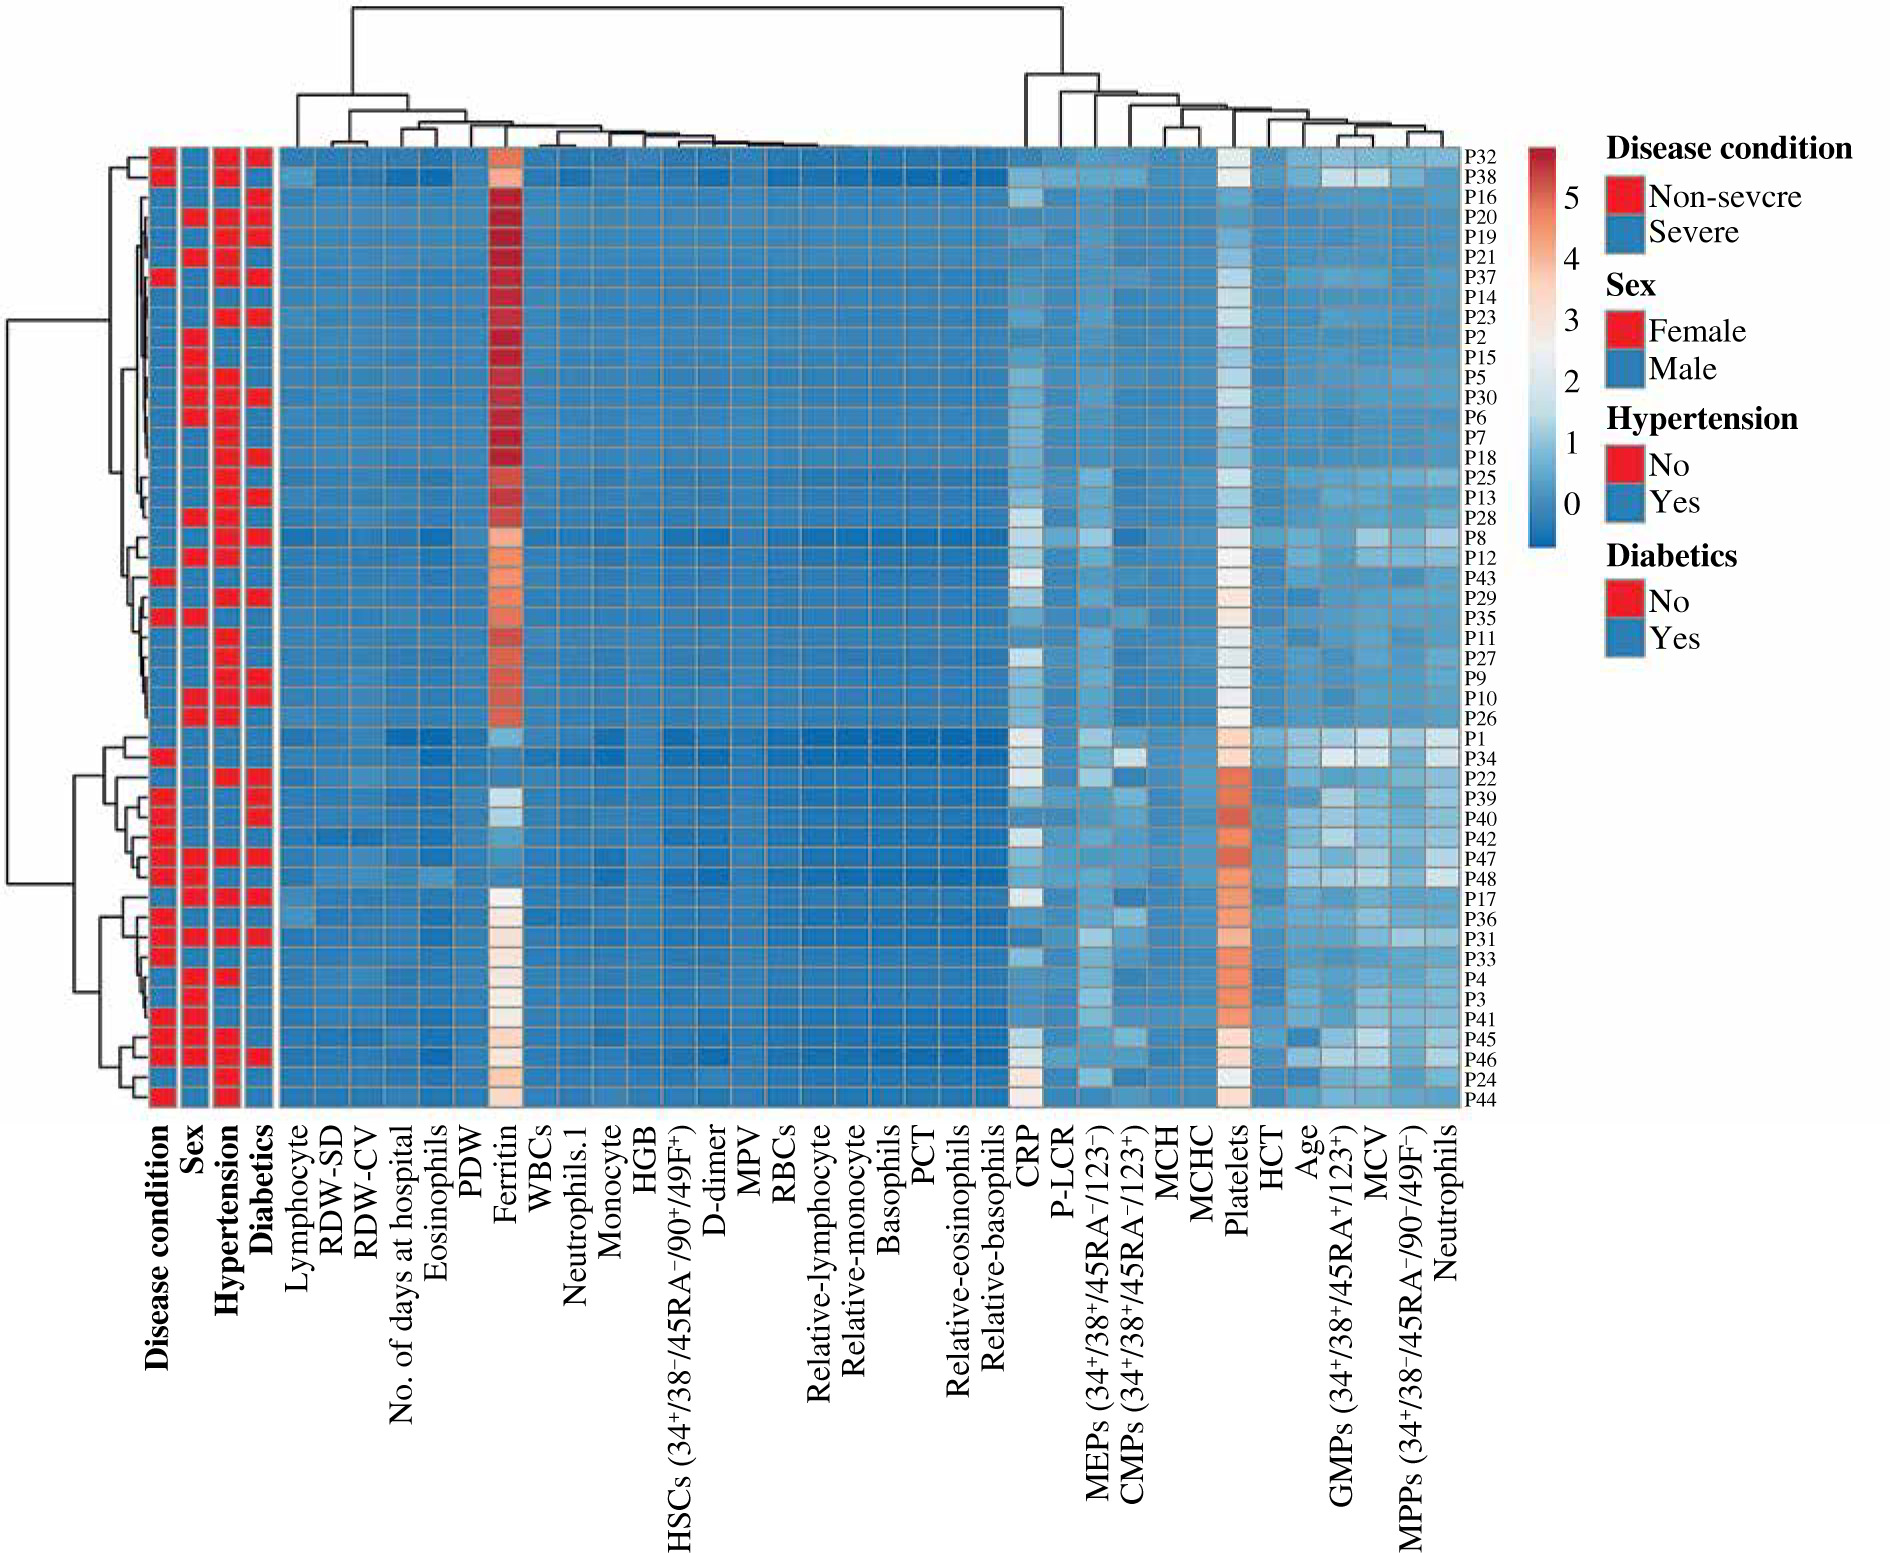
Baseline characteristics and laboratory features of COVID-19 patients are displayed in Table 3 and Figure 2. The mean age of COVID-19 patients was 60.30 ±2.25 years, and 27 patients (56.25%) were male (Table 3). 33.33% (16/48) and 58.33% (28/48) of patients had hypertension and diabetes, respectively. 30 patients (62.5%) had severe COVID-19 and 18 (37.5%) patients had non-severe COVID-19.
Table 3
Baseline characteristics and laboratory features of COVID-19 patients
| Parameters | Reference range | COVID-19 patients (n = 48) | ||
|---|---|---|---|---|
| Value | Std. error/% | |||
| Age (years), mean ±SE | – | 60.30 | 2.24 | |
| Sex | – | |||
| Male | 27 | 56.25 | ||
| Female | 21 | 43.75 | ||
| Hypertension | 120/80 [33] | 16 | 33.33% | |
| Diabetics | 74-106 mg/dl or 4.1-5.9 mmol/l [34] | 28 | 58.33% | |
| CRP | < 1.0 mg/dl or < 10.0 mg/l (SI units) [33] | 110.8 | 36.59 | |
| Ferritin | Male: 12-300 ng/ml Female: 10-150 ng/ml [33] | 611.2 | 194.51 | |
| D-dimer | Up to 0.55 mg/l [33] | 3.364 | 1.05 | |
| RBCs | Male: 4.35 to 5.9 ×10⁶/µl Female: 3.5 to 5.5 ×10⁶/µl [35] | 4.703 | 0.21 | |
| HGB | Male: 13.5 to 17.5 g/dl Female: 12 to 16 g/dl [35] | 12.68 | 0.56 | |
| HCT | Male: 41-53% Female: 36-46% [35] | 37.78 | 1.67 | |
| MCV | 80-100 fl [35] | 80.81 | 1.59 | |
| MCH | 25.4-34.6 pg [35] | 27.14 | 0.63 | |
| MCHC | 31-36 g/dl [35] | 33.55 | 0.34 | |
| RDW SD | 36-47 fl [36] | 42.89 | 1.69 | |
| RDW CV | 11-15% [36] | 14.82 | 0.55 | |
| Platelets | 150-400 ×103/µl [35] | 259.3 | 23.13 | |
| PDW | 9.1-15.4% [37] | 13.89 | 0.69 | |
| MPV | 9-12 fl [37] | 10.91 | 0.25 | |
| PLCR | 14.7-55.3 [37] | 33.01 | 1.77 | |
| PCT | 0.15-0.45% [37] | 0.2976 | 0.024 | |
| WBCs | 4.5-11.0 ×10³/µl [35] | 11.94 | 1.13 | |
| Neutrophils | 2.5-8 ×10³/µl 55-70% [33] | 10.25 83.31 | 1.06 2.12 | |
| Lymphocytes | 1-4 ×10³/µl 20-40% [33] | 0.9867 | 0.11 | |
| Monocytes | 0.1-0.7 ×10³/µl [33] | 0.6604 | 0.081 | |
| Eosinophils | 0.05-0.5 ×10³/µl [33] | 0.01875 | 0.01 | |
| Basophils | 0.1-0.2 ×10³/µl [33] | 0.02583 | 0.01 | |
COVID-19 is associated with phenotypical changes in HSCs and their subpopulations
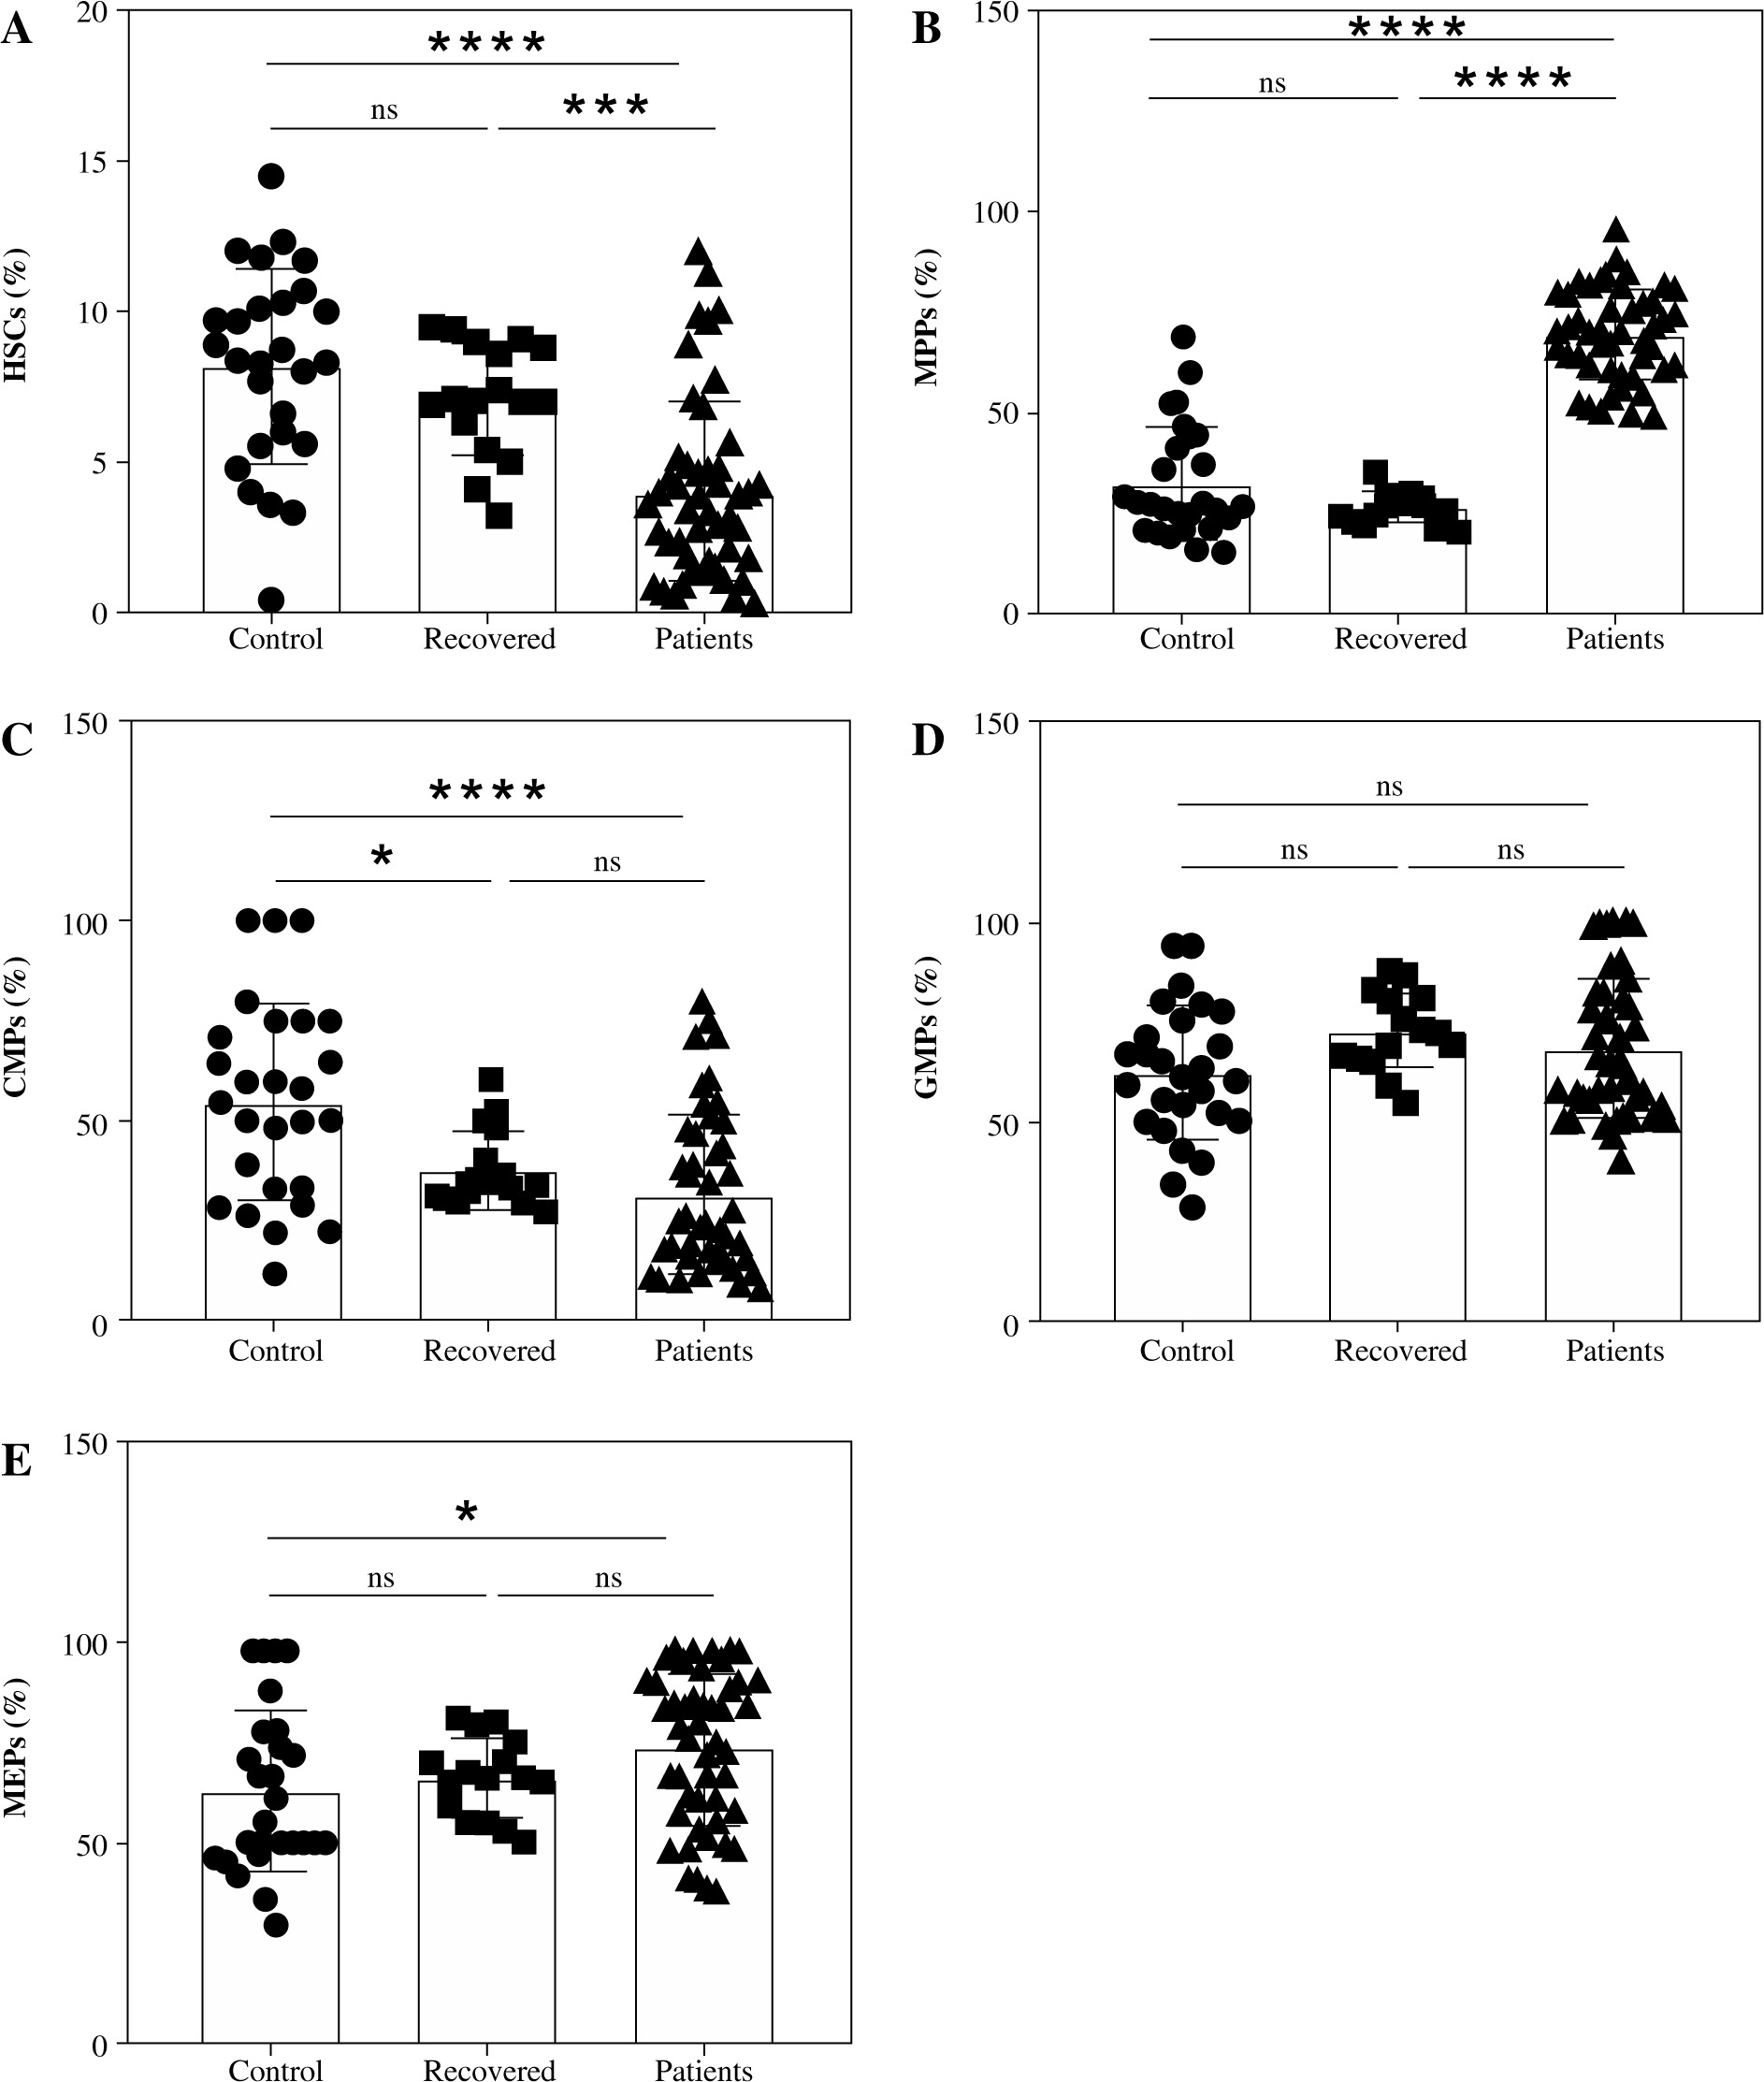
To assess the dynamic change in the percentages of HSCs and their subpopulations in COVID-19, we used the subsequent gating strategy as illustrated in Table 2 and Figure 1. The percentage of HSCs declined significantly in COVID-19 patients compared to recovered patients and healthy controls (Fig. 3A). Contrarily, the MPP percentage was significantly increased in COVID-19 patients compared to recovered patients and healthy subjects (Fig. 3B). There were no significant differences in the percentage of HSCs and MPPs between recovered patients and healthy controls (Fig. 3A, B). We detected a substantial decrease in CMP compartments in COVID-19 patients and recovered individuals compared to healthy control (Fig. 3C). There were no significant differences in CMP compartments between COVID-19 patients and recovered individuals. On the other hand, there were also no significant alterations in the percentage of GMP compartments between all the tested groups (Fig. 3D). However, the MEP compartment elevated significantly in patients compared to controls and recovered individuals (Fig. 3E).
Phenotypical changes in HSCs and their subpopulations in severe COVID-19 patients
In comparison to non-severe COVID-19 patients, severe cases exhibited a markedly lower HSC percentage (Fig. 4A). On the other hand, there were no significant changes in the percentage of MPPs between severe and non-severe COVID-19 patients (Fig. 4B). The CMP compartment (Fig. 4C) and GMP compartment (Fig. 4D) were significantly reduced in severe COVID-19 patients compared to non-severe cases. In contrast, the MEP compartment was significantly increased in severe COVID-19 patients compared to non-severe cases (Fig. 4E).

D-dimer, ferritin, and C-reactive protein levels and their correlation with HSCs and their subpopulations in severe COVID-19 patients
D-dimer, ferritin, and CRP are critical biomarkers for determining the severity of COVID-19 [13-15]. To determine the correlation between these biomarkers and HSCs and their sup-sets in severe and non-severe COVID-19 patients we determined the levels of D-dimer, ferritin, and CRP in severe and non-severe patients. The levels of D-dimer, ferritin, and CRP were correlated with the disease severity (Fig. 5). The level of CRP was significantly increased in severe compared to non-severe COVID-19 patients (Fig. 5A). Similarly, the levels of D-dimer (Fig. 5B) and ferritin (Fig. 5C) were markedly higher in severe COVID-19 patients compared to non-severe cases.
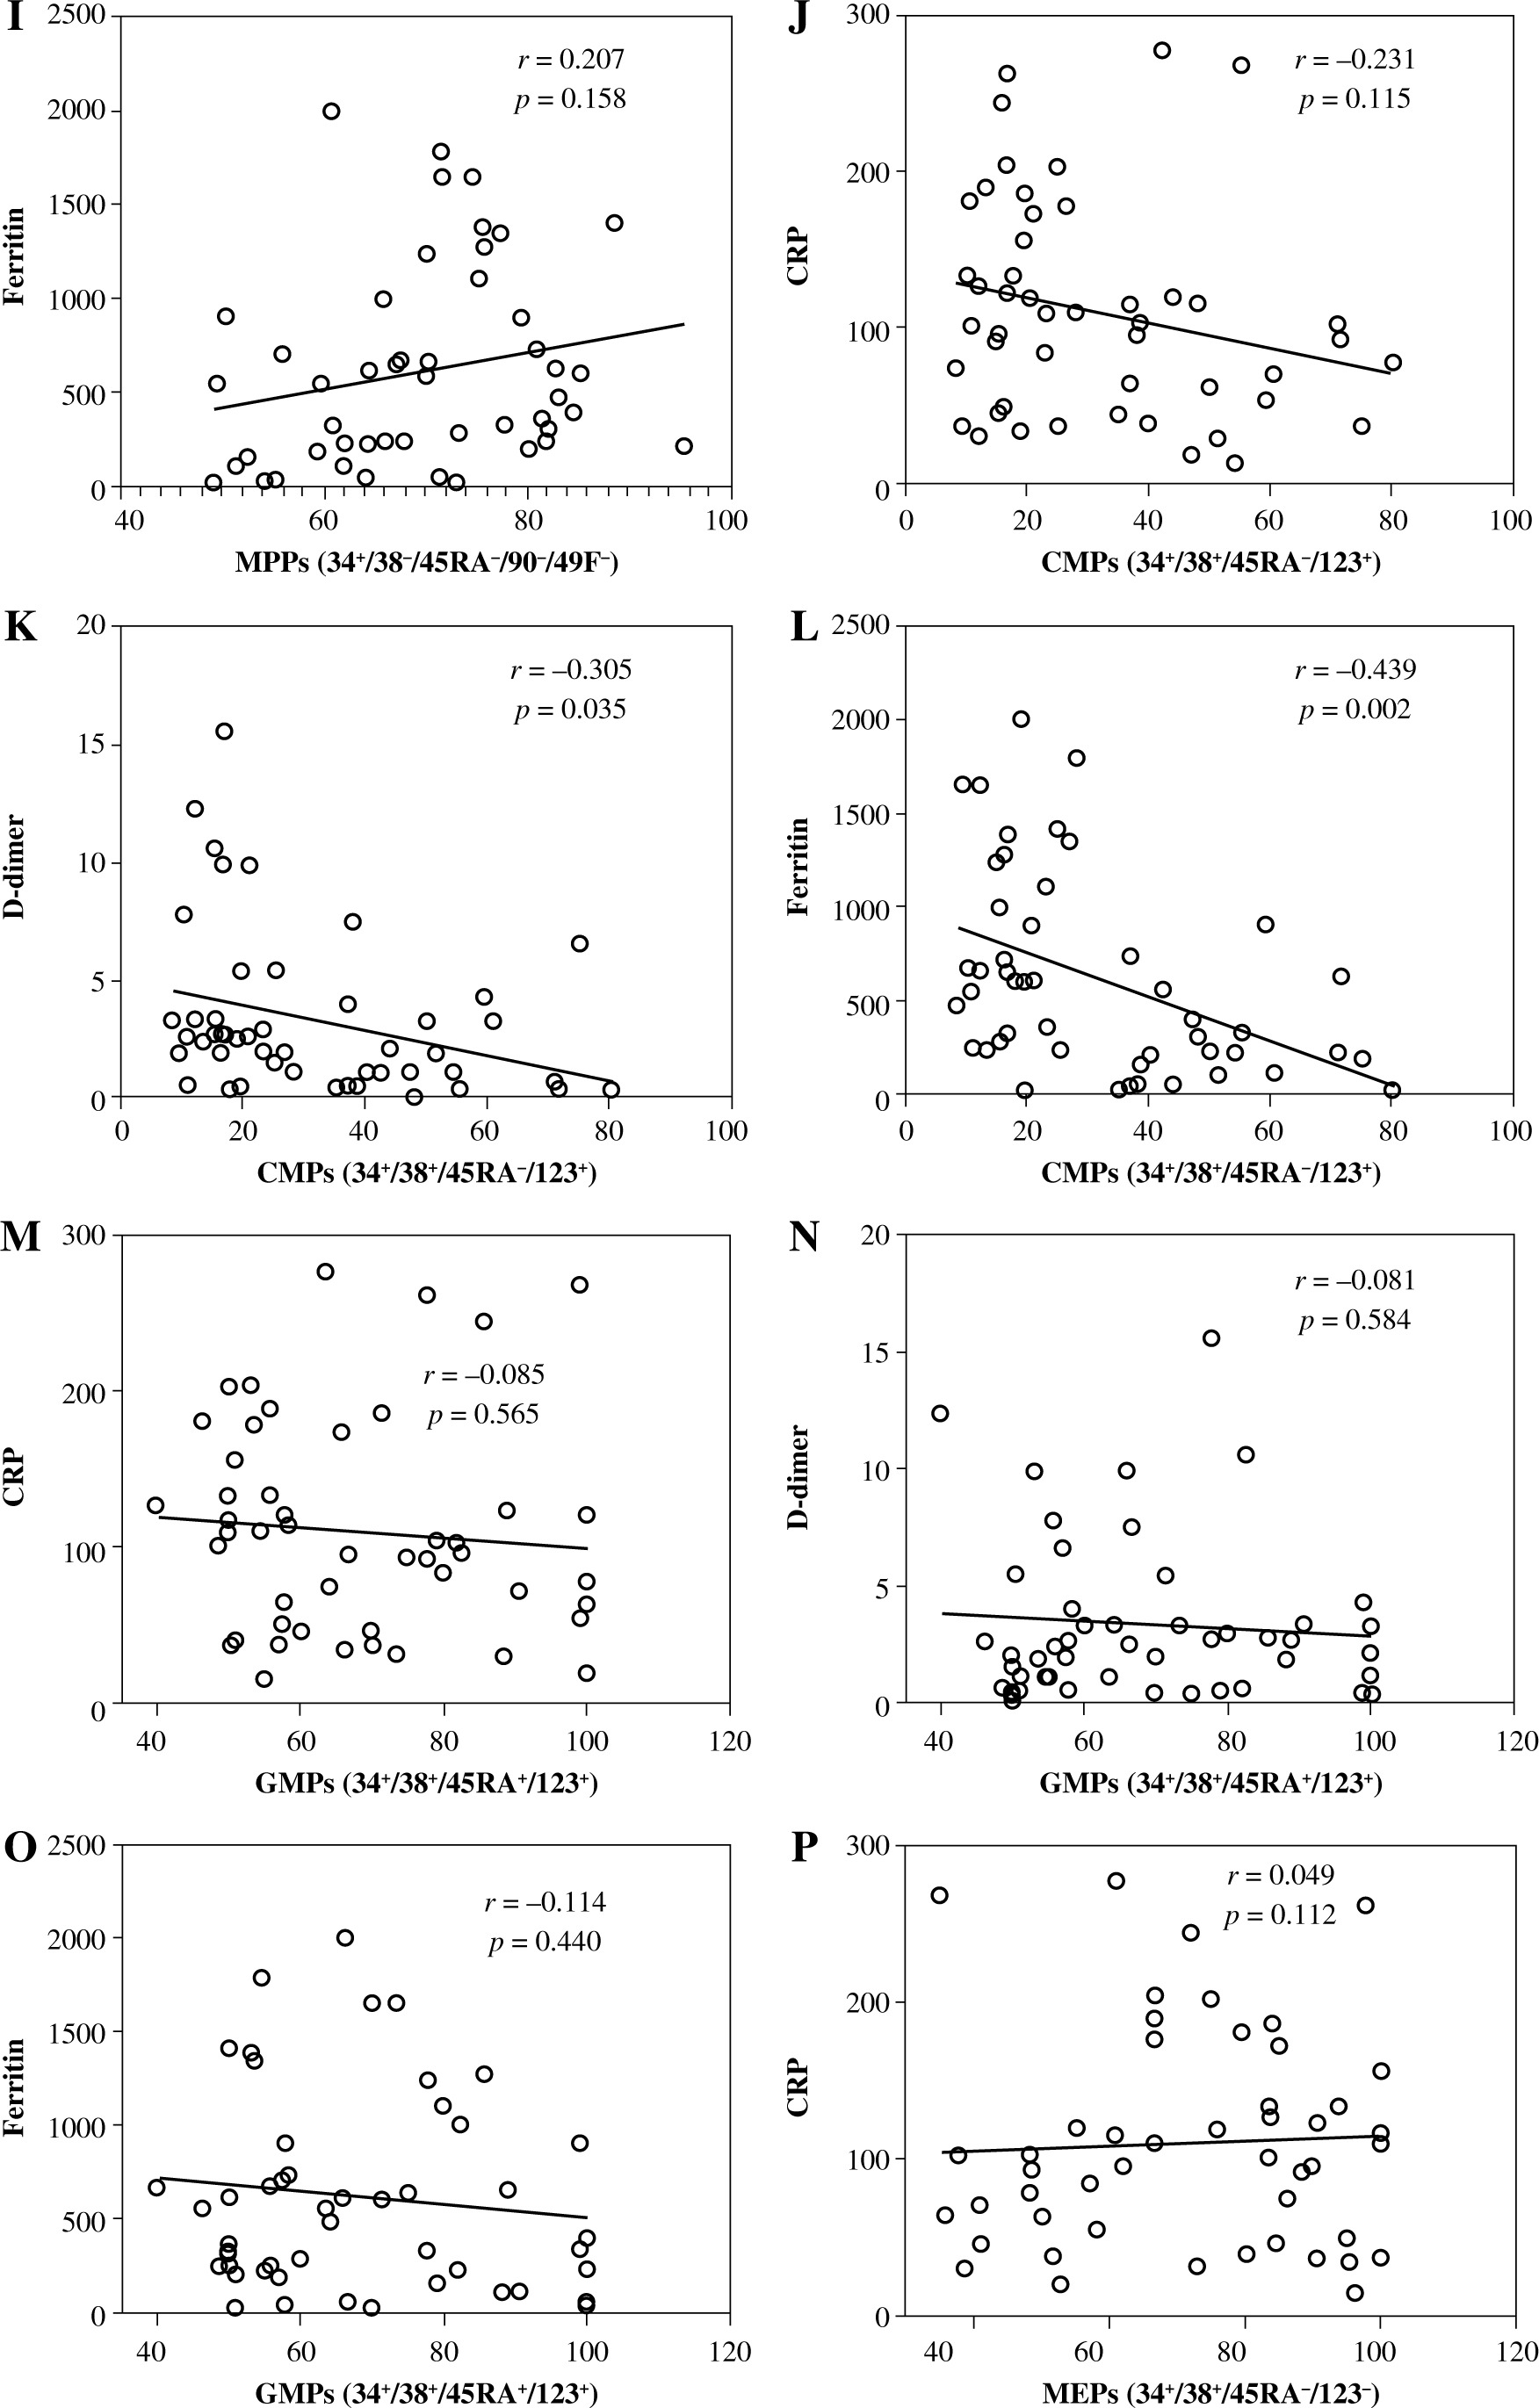
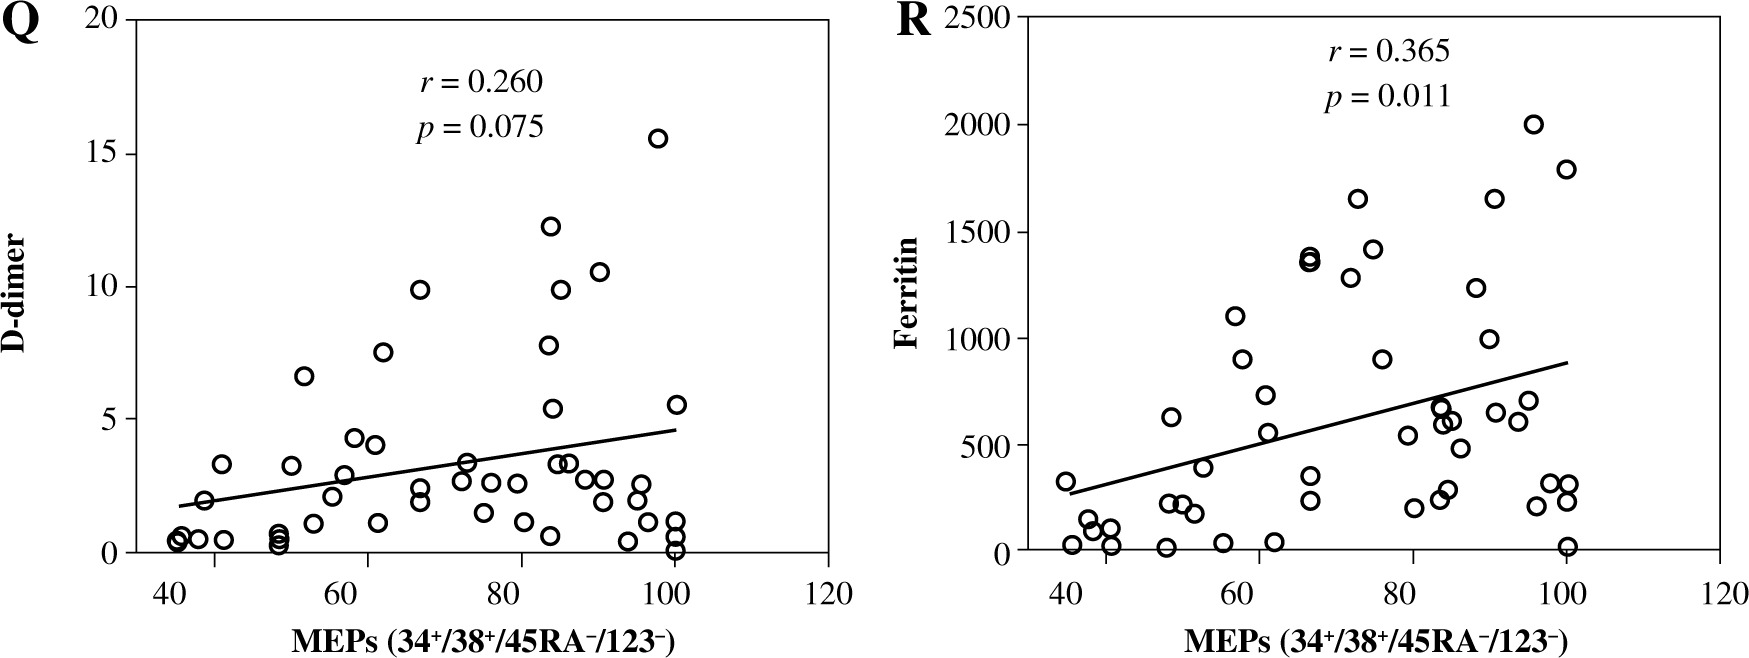
Fig. 5
Levels of CRP, D-dimer, and ferritin and their correlation with HSCs and their subpopulations in severe and non-severe COVID-19 patients. Levels of CRP (A), D-dimer (B), and ferritin (C). Relationships between levels of CRP, D-dimer, and ferritin and percentages of HSCs (D, E), MPPs (G-H). Asterisks indicate significant correlations among different groups with the following p values: **p < 0.01, ***p < 0.001, ****p < 0.0001
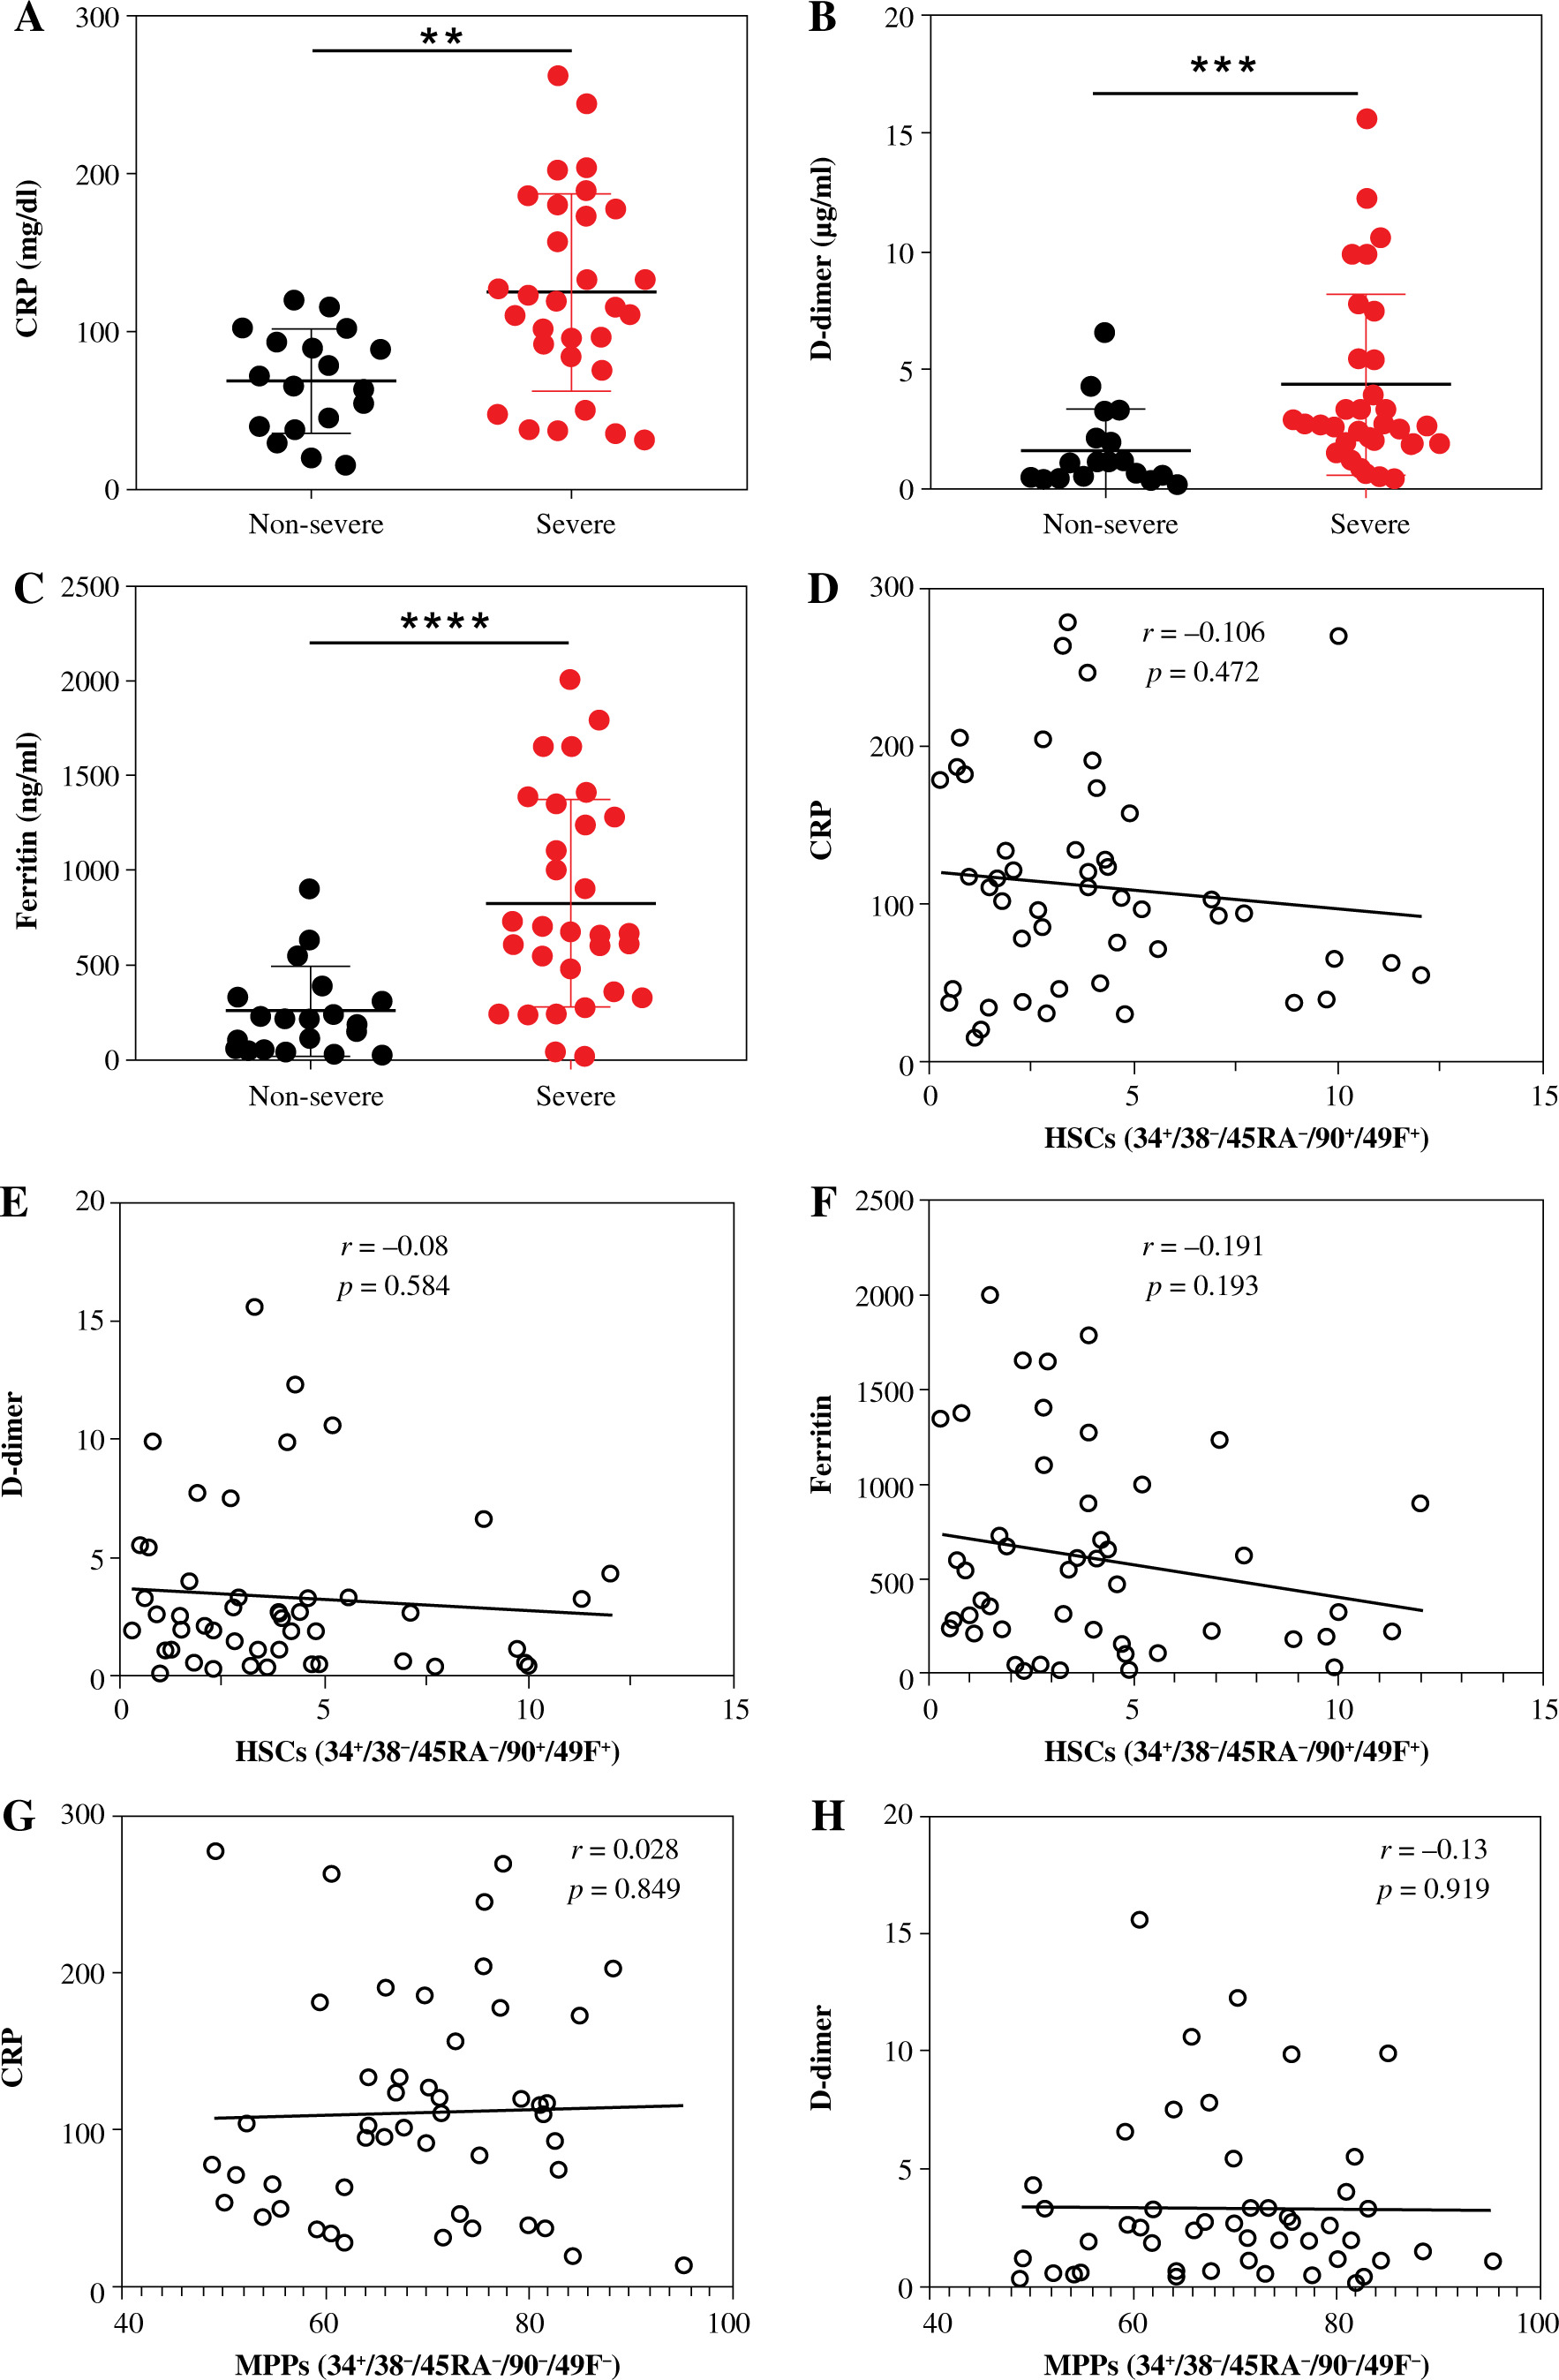
HSCs and their subsets were varied in their correlations with CRP, D-dimer, and ferritin levels. We detected non-significant negative correlations between HSC percentage and the levels of CRP (Fig. 5D), D-dimer (Fig. 5E), and ferritin (Fig. 5F). On the other hand, MPPs were positively correlated with CRP (Fig. 5G) and ferritin (Fig. 5I), while they were negatively correlated with D-dimer (Fig. 5H). However, the correlations between MPPs and CRP, ferritin and D-dimer were non-significant. There was a non-significant negative correlation between CMPs and CRP (Fig. 5J). On the other hand, we detected significant negative correlations between CMPs and D-dimer (Fig. 5K), and ferritin (Fig. 5L). We also detected non-significant negative correlations between GMPs and CRP (Fig. 5M), D-dimer (Fig. 5N), and ferritin (Fig. 5O). Correlations between MEPs and CRP (Fig. 5P), and D-dimer (Fig. 5Q) were positive but non-significant, while the correlation between MEPs and ferritin (Fig. 5R) was positive and significant.
Evaluation of the diagnostic performance of HSCs and their subpopulations
Receiver operating characteristic (ROC) curve analysis was used to evaluate the diagnostic performance of HSCs and their subpopulations in differentiating between healthy controls and COVID-19 patients as well as severe and non-severe cases. The area under the curve (AUC) was used to determine the diagnostic performance as previously described [16, 17]. AUC values of 0.9 to 1.0 were considered as excellent, AUC values of 0.8 to 0.9 were considered as good, AUC values of 0.7 to 0.8 were considered as fair, AUC values of 0.6 to 0.7 were considered as poor, and AUC < 0.6 was considered as not useful [16].
MPP percentages were the most effective in distinguishing COVID-19 patients from healthy controls with an AUC value of 0.986 at a cutoff point of 54 and p value < 0.00001 (Fig. 6A). Similarly, HSC percentages were effective in distinguishing COVID-19 patients from healthy controls and their AUC value, cutoff point, and p value were 0.824, 5.5, and < 0.00001, respectively (Fig. 6A). The AUC value, cutoff point, and p values of CMPs were 0.764, 48.5, and < 0.00001, respectively (Fig. 6A). On the other hand, the percentages of MEPs and GMPs poorly distinguished COVID-19 patients from healthy controls.
Fig. 6
ROC curve analysis for evaluation of the diagnostic performance of HSCs, HPCs CRP, D-dimer, and ferritin in differentiating between healthy controls and COVID-19 patients (A) and severe and non-severe cases of COVID-19 (B, C)
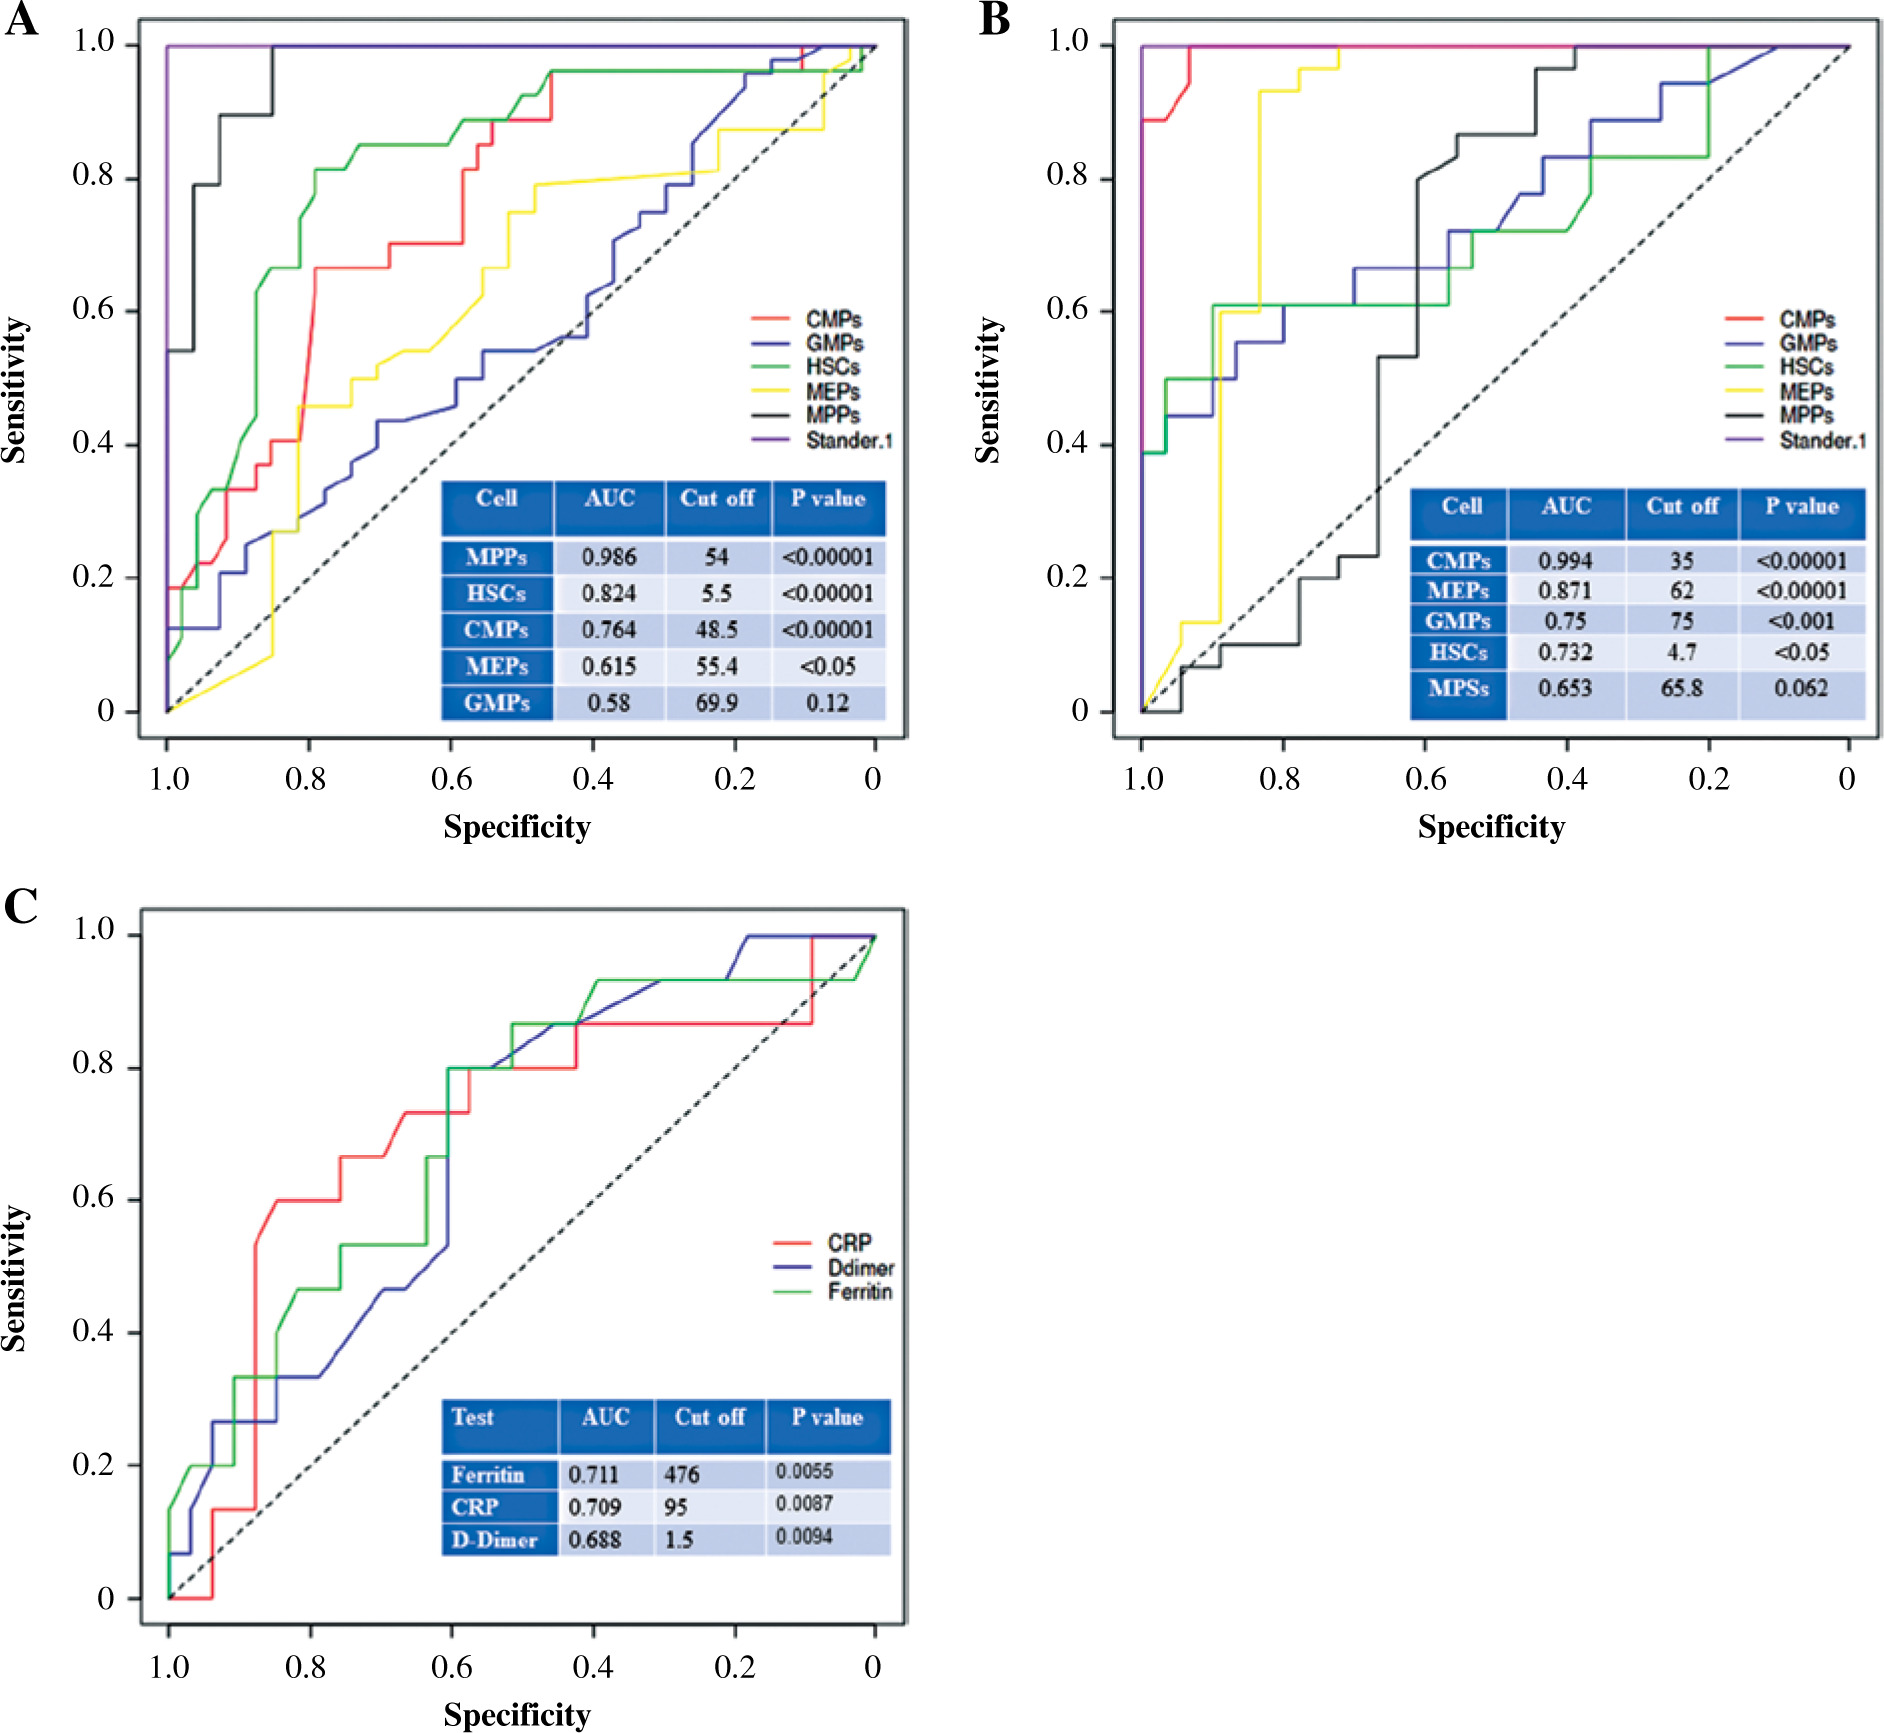
In distinguishing severe from non-severe COVID-19 patients, CMP percentages were very effective with an AUC value of 0.994 at a cutoff point of 35 and a p value < 0.00001 (Fig. 6B). Moreover, MEP percentages were good for distinguishing severe from non-severe COVID-19 patients and their AUC value, cutoff point, and p values of CMPs were 0.871, 62, and < 0.00001, respectively (Fig. 6B). GMPs and HSCs were fairly while MPPs poorly distinguished severe from non-severe COVID-19 patients (Fig. 6B).
We also evaluated the diagnostic performance of CRP, D-dimer, and ferritin in differentiating between healthy and COVID-19 patients. Ferritin and CRP were more effective than D-dimer in distinguishing severe from non-severe COVID-19 patients (Fig. 6C). AUC, cutoff, and p value for ferritin were 0.711, 476, and 0.005 and for CRP were 0.709, 95, and 0.0087 (Fig. 6C). D-dimer levels poorly distinguished between severe and non-severe COVID-19 patients with AUC of 0.688 at a cutoff value of 1.5 with a p value of 0.0094 (Fig. 6C). Interestingly, CMPs, MEPS, GMPs, and HSCs were more efficient than CRP, D-dimer, and ferritin in distinguishing severe from non-severe COVID-19 patients (Fig. 6B, C).
Discussion
Hematopoietic stem cells play a significant role in the immune response to pathogens. Thus, proper proliferation and differentiation of HSCs are critical for determining the disease outcome. Blood HSCs and HPCs are low in quantity, yet a readily accessible and non-invasive way to monitor the function of HSCs and their sub-populations. In the context of SARS-CoV-2 infection, the implications of phenotypic changes of HSC and HPC compartments during the antiviral response are not fully elucidated [18]. In this study, we aimed to monitor the phenotypic changes in HSCs and their sub-populations in COVID-19 patients with a focus on the variations in the percentages of these cells and their sub-populations in severe vs non-severe COVID-19 cases. Moreover, we defined the correlation between HSC sub-populations and other important biomarkers for severe cases. Finally, we determined the diagnostic values of HSC sub-populations in identifying severe COVID-19 cases.
COVID-19 patients exhibit dysfunctions and dysregulation of the immune response. Dysfunctions of terminally differentiated effector immune cells have been well documented in severe COVID-19 patients, suggesting the impact of SARS-CoV-2 infection on hematopoiesis and primitive blood cell populations [8, 18, 19]. In this study, our results indicated that the percentages of HSCs and their subpopulations significantly differed in COVID-19 patients compared to healthy controls. This could be attributed to the effect of coronavirus infection on the proliferation and plasticity of hematopoietic stem and progenitor cells [20-22]. The effect of SARS-CoV-2 infection on hematopoietic stem and progenitor cells could also be attributed to the role of ACE (angiotensin-converting enzyme), the major SARS-CoV-2 entry receptor in regulating the aspects of hematopoiesis and maturation of hematopoietic cells [23, 24]. In vivo and in vitro experiments demonstrated the involvement of ACE in the differentiation of hematopoietic cells through enhancing myeloid maturation to a more pro-inflammatory phenotype while inhibiting the development of myeloid-derived suppressor cells (MDSCs) [25]. Interestingly, the SARS-CoV-2 spike protein (S) has been shown to bind to the ACE2 receptor on CD34+ hematopoietic stem cells and trigger Nlrp3 inflammasome activation, which led to cell death by pyroptosis [26, 27]. Moreover, HSCs and HPCs expand less effectively when treated with SARS-CoV-2 S protein and their colony-forming capacity is significantly reduced [28].
In this study, we revealed that HSCs significantly decreased while MPPs increased in COVID-19 patients compared to healthy controls and recovered individuals. The decrease in HSC compartment in COVID-19 patients could be attributed to the fact that these cells express the highest percentage of ACE2 compared to other hematopoietic sub-populations, making them the hematopoietic cells most susceptible to the impact of SARS-CoV-2 on the hematopoietic system [28]. Interestingly, the expansion of HSCs, CMPs, and GMPs is significantly reduced when these cells are incubated with SARS-CoV-2 S protein [28]. This confirms our finding that the percentage of HSCs, CMPs, and GMPs significantly decreased in severe COVID-19 patients compared to non-severe cases. In contrast to our finding that the percentage of MPPs is significantly increased in COVID-19 patients, in their study Ropa et al. [28] reported that the expansion of MPPs was reduced when cells were treated with SARS-CoV-2 S protein, which could be attributed to the experimental variations as they used an ex vivo model in their study.
Early diagnosis of severe COVID-19 patients has been proven to be critical for the survival of critically ill patients. Our results demonstrate that increasing levels of CRP, D-dimer and ferritin correlate with disease severity and are very useful biomarkers for identifying patients who are prone to the severe stage of COVID-19 [29-32]. Interestingly, we found a significant positive correlation between MPP percentage and CRP and ferritin levels. Similarly, MEP percentages were positively correlated with ferritin. On the other hand, we detected significant negative correlations between CMPs and D-dimer and ferritin. These findings indicate the usefulness of MPP, MEP, and CMP percentages as potential prognostic biomarkers for the severe stage of COVID-19. MPPs are superior in distinguishing COVID-19 patients from healthy controls, while CMPs and MEPs were the most effective hematopoietic progenitor cells in distinguishing severe COVID-19 patients. Interestingly, CMPs, MEPs, and GMPs identify disease severity better than CRP, D-dimer, and ferritin. This indicates the diagnostic value of HSCs and their subpopulations in COVID-19 patients and makes them prominent targets for the development of diagnostic biomarkers for COVID-19.
While this study offers valuable insights on the impact of COVID-19 on hematopoietic stem and progenitor cells, it has certain limitations. Although it aimed to delineate the phenotypic alterations of peripheral blood hematopoietic stem/progenitor cells (HSPCs) in response to COVID-19, the lack of molecular data is a drawback. Future studies will be particularly important to elucidate the molecular impact of COVID-19 on hematopoietic stem/progenitor cells (HSPCs) in the matter of cellular differentiation and lineage commitment. The small sample size of participants in this study is another limitation. To enhance the statistical power of the findings, it is necessary to increase the number of participants.
Conclusions
In this study, we have delineated the phenotypic changes in HSCs and their subpopulations in the context of COVID-19. Our results indicate that hematopoietic stem and progenitor cells are significantly affected by COVID-19. Interestingly, our findings indicate that the diagnostic performance of HSCs and their subpopulations outweighs the performance of COVID-19 related diagnostic tests such as CRP, D-dimer, and ferritin. These findings could thus be used in a future study to develop diagnostic tools for severe COVID-19 based on HSCs and their sub-populations. Moreover, this study could inform antiviral therapeutics against SARS-CoV-2, using progenitor-based approaches. This study has implications for developing effective therapeutic strategies against SARS-CoV-2, using hematopoietic stem progenitor cell-based approaches.