Introduction
The homologous gene LFY (LEAFY) regulates cell proliferation and flower development in plants. It is widely distributed in algae, mosses, ferns, gymnosperms, and flowering plants (Villimová, 2012). LFY homologs reported in aquatic Charophyte green algae are closely related to those found in land plants. LFY encodes a plant-specific transcription factor that functions as an activator or a repressor, depending on the cofactor it interacts with (Siriwardana and Lamb, 2012). In Physcomitrella patens, LFY regulates cell division in gametophytes and sporophyte (Tanahashi et al., 2005), whereas LFY homologs in the fern Ceratopteris richardii function in shoot development (Plackett et al., 2018). LFY is a floral meristem identity gene that controls multiple aspects of inflorescence development in the flowering plant Arabidopsis thaliana (Weigel and Nilsson, 1995), and it is active during reproductive structure development in gymnosperms (Dornelas and Rodriguez, 2005; Moyroud et al., 2017). An increase in the expression of LFY results in early flowering, and a mutation in LFY causes a transition of flowers into leaves and shoots (Weigel et al., 1992). Charophytes (algae) (Domozych et al., 2016), P. patens (moss) (Cove et al., 2009), C. richardii (fern) (Hickok et al., 1995; Renzaglia and Warne, 1995), Picea abies (Spruce) (Nystedt et al., 2013), and Arabidopsis thaliana (flowering plant) (Ezhova, 1999) are model organisms for genetic, developmental, and evolutionary studies. In the present study, LFY homologs of few model plants were analyzed to determine molecular differences, i.e., their transition changes during evolution from simple to complex structures in plants. The diverging lineage of the LFY gene, which is modified and altered during the evolution of floral meristems, will help us to understand the origin of flower development or the lack of it in plants. The present study attempted to corroborate the molecular changes of LFY and the evolution of flowering in plants from Charophyte green algae to angiosperms.
Prediction of structure is imperative to study the biochemical and cellular functions of proteins. X-ray crystallography, NMR spectroscopy, and electron microscopy are the techniques currently used for protein structure prediction; however, these methods are time-consuming and require expensive wet lab tools (Venkatesan et al., 2013). Computational tools have been used for the past 30 years in protein structure prediction and continue to help researchers in experimental investigations on a large scale (Nagano, 1973; Gupta et al., 2014; Kc, 2017; Kuhlman and Bradley, 2019). Computational techniques have improved the success rate in protein prediction methods in the last decade. The prediction methods are categorized into comparative modeling (homology modeling) (Šali and Blundell, 1993; Lam et al., 2017), threading (Panchenko et al., 2000; Skolnick and Kihara, 2001; Xu et al., 2007), and ab initio modeling (free modeling) (Ortiz et al., 1998; Simons et al., 2001; Lee et al., 2017). The most accurate method for protein structure prediction is homology modeling, which is used to construct 3D models of unknown target sequences based on known structures (templates) with sequence similarity >30% (Cavasotto and Phatak, 2009) collected from databases by using software or web servers (Eswar et al., 2003; Pieper et al., 2006). The process of homology modeling involves template search of related structures for query sequence, multiple sequence alignment of targets and template structures, construction of a 3D model, and finally, evaluation of the model (Hasani and Barakat, 2017; Studer et al., 2019). The steps are repeated to obtain an optimum model (Martí-Renom et al., 2000). The 3D structures of proteins are more conserved than their amino acid sequences, and minor changes in sequences usually result in a slight variation in their 3D structure (Lesk and Chothia, 1986).
In the present study, the homologous sequences of the LFY gene were compared to analyze its phylogenesis and physicochemical properties of the gene product; moreover, protein structure prediction and construction of 3D models of protein and their evaluation were performed. The LFY homologous sequences from algae to flowering plant model systems were elaborated. A comparative analysis of the homologous genes was conducted virtually to study their structure, function, phylogeny, and proteins.
Materials and methods
Data mining from database and phylogeny construction
Complete and partial LEAFY protein sequences of the LFY gene of all available plant families (supplementary Table 1) were collected from GenBank NCBI (National Centre for Biotechnology Information) (http://www.ncbi.nlm.nih.gov) in FASTA format after clicking protein search, followed by building datasets of sequences using Notepad from the Protein database of related organisms in NCBI [LEAFY in plants – Protein – NCBI (nih.gov)]. A phylogenetic tree was constructed using MEGA 7 (Molecular Evolutionary Genetic Analysis version 7) software with the neighbor-joining method with bootstrapping values for 1000 replicates. The evolutionary distance was computed using the p-distance method. All the LEAFY protein sequences were copied onto MEGA 7 software and aligned using ClustalW. Complete and partial sequences of the LEAFY protein of charophyte green algae – Klebsormidium subtile and Coleochaete scutata (2 sequences), P. patens (2 sequences), Ceratopteris sp. (3 sequences), Picea sp. (2 sequences), and A. thaliana (3 sequences) were used (supplementary Table 1 and Table 2). The aligned sequences were then exported to conduct phylogenetic analysis. The phylogeny analysis was conducted using Neighbor Joining Tree method. It was further tested with the Bootstrap method. A total of 1000 bootstrap replications were used to compute and construct a phylogenetic tree.
Motif search
The Motif Finder server (https://www.genome.jp/tools/motif/) was used to analyze the family or the protein domain of the protein sequences. FASTA sequences of the protein were entered as a query sequence in the Motif Finder server. The results showed LEAFY protein sequences of all model organisms with conserved domains from Pfam databases. These sequences were confirmed in the CDD database (NCBI) webserver (https://www.ncbi.nlm.nih.gov/Structure/cdd/wrpsb.cgi) by using the protein accession number of the respective organisms.
Multiple sequence alignment
FASTA sequences of LEAFY proteins were aligned using the Clustal Omega Multiple Sequence Alignment Program [CLUSTAL O (1.2.4)] (https://www.ebi.ac.uk/Tools/msa/clustalo/) using complete and partial sequences of LEAFY proteins. FASTA sequences of LEAFY proteins were also used for screening sequence alignment of conserved, conservative mutated, semi-conservative mutated, and nonconservative mutated sequences among the species analyzed.
Physicochemical analysis
The amino acid sequences of LEAFY proteins were determined for analyzing physicochemical properties in the ProtParam tool – ExPASy (http://web.expasy.org/protparam) that computes various parameters such as molecular weight (MW), isoelectric point (pI), instability index (II), aliphatic index (AI), and grand average of hydropathicity (GRAVY). Each amino acid sequence was imported into the ProtParam tool ExPASy and computed for analyzing various parameters of LEAFY protein sequences.
Structure prediction and analysis
The secondary structure of the LEAFY protein was predicted using the PSI-blast-based secondary structure tool PREDiction (PSIPRED 4.0), and the 3D model was generated using PHYRE 2 (ProteinHomology/analogy RecognitionEngineV2.0) (http://www.sbg.bio.ic.ac.uk/~phyre2/html/page.cgi?id=index) program. Multiple sequences of each model plant were batch-processed while uploading onto the PHYRE2 server. The LEAFY protein sequence was submitted in FASTA format and processed for the following information: 1) summary and sequence analysis details, 2) secondary structure and disorder prediction, 3) domain analysis, and 4) detailed template alignment information with figures. Secondary structure was predicted as α-helix, β-strand, coils, and disorder in the structure analysis report.
Protein modeling and validation
Protein homology modeling for LEAFY proteins was performed with the SWISS-MODEL https://swissmodel.expasy.org/ web server. Protein modeling involved the following: 1) identification of template structure, 2) alignment of the target sequence and template structure, 3) model building, and 4) model quality evaluation.
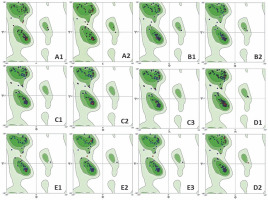
The best models of LEAFY protein structures for all the plant models were evaluated for quality by using the structure validation tool MolProbity (http://molprobity.biochem.duke.edu/). The PDB code of the protein structure was further validated using their web server. The analysis revealed the distribution of residues in the torsion angles (φ and ψ) of Ramachandran plot with the φ and ψ values between +180 and –180 on the x-axis and y-axis, respectively. The percentage of residues in the favored, allowed region and outliers from the Ramachandran plot analysis were also detected.
Results and discussion
Evolution of the LFY gene in the plant family
Forty-one LEAFY protein sequences of different plant families were downloaded from GenBank (Table 1), and phylogenetic analysis was conducted. The phylogenetic tree (Fig. 1) illustrates the relationship among 41 amino acid sequences of LEAFY proteins analyzed in MEGA7 with 1000 bootstrap replicates using the neighborjoining method. The bootstrap percentage specifies the reliability of each node of the phylogenetic tree, and an estimate of < 70% reliability on tree topology is not considered to be acceptable (Hall, 2013). The p-distance method was used to compute evolutionary distances with the differences in the number of amino acids per site.
Table 1
List of LEAFY homolog of different plant families from GenBank NCBI
Fig. 1
Phylogenetic tree constructed in MEGA 7 with 41 LEAFY protein sequences; bootstrap values are listed next to the branch
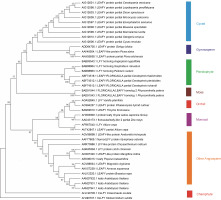
LEAFY protein sequences of Charophyte green algae were placed at the base of the phylogenetic tree and grouped into two distinct clusters. One cluster of LEAFY protein sequences was present in flowering plants starting from orchids to Arabidopsis, such as Vanilla planifolia, Phalaenopsis hybrid cultivar, Tricyrtis formosana, Oryza sativa Japonica Group, Zea mays, Allium cepa, Amborella trichopoda, Nymphaea odorata, Chrysanthemum indicum, Litchi chinensis, Mangifera indica, Populus balsamifera, Magnolia virginiana, Annona squamosa, Brassica rapa, and A. thaliana. The second cluster contained all nonflowering plants such as mosses, pteridophytes, gymnosperms, and cycads. It is reported that the plant-specific transcription factor LFY evolved in Streptophyte algae (Wilhelmsson et al., 2017). The LEAFY protein sequence of pteridophytes is closer to that of cycads and gymnosperms than to that of orchids, monocots, and other angiosperms, which indicates structural and functional similarity to LEAFY from gymnosperms. The tree shows an early alteration in the LFY homolog, which segregated and evolved into two clusters of flowering and nonflowering plants. It is also reported that ancient gene duplication and sub-functionalization processes influenced the evolution of the LEAFY gene (Gao et al., 2019).
Description of the candidate LEAFY protein
The LEAFY protein sequences from 2 species of Charophyte green algae (K. subtile – 495 aa and C. scutata – 328 aa), 2 moss species (P. patens – 349 aa, P. patens – 348 aa), 2 gymnosperm species (P. abies – 386 aa and P. sitchensis – 380 aa), 3 pteridophytes species (C. thalictroides – 237 aa, C. pteridoides – 237 aa, C. richardii – 237 aa), and 3 angiosperm species (A. thaliana – 424 aa) were collected from the NCBI protein database (Table 2) and analyzed.
Table 2
Description and list of LEAFY homolog of Charophyte green algae, Physcomitrella sp., Ceratopteris sp., Picea sp., and Arabidopsis sp. from GenBank NCBI
The LFY transcription factor gene evolved from algae (charophyte) (Sayou et al., 2014; Brunkard et al., 2015; Gao et al., 2019). LEAFY/LFY homologs in different model organisms, such as FLO/LFY genes (PpLFY1, PpLFY2), regulate the first zygotic cell division in P. patens (Tanahashi et al., 2005). LFY maintains apical stem cell activity in gametophyte and sporophyte during shoot development in C. richardii (Plackett et al., 2018). In gymnosperms, LFY and the paralog of LFY – NEEDLY (NLY) regulate male and female reproductive structures (Silva et al., 2016), and their expression levels were characterized in Picea sp. (Vázquez-Lobo et al., 2007). Moreover, LFY, the plant-specific transcription factors, are conserved as floral meristem identity genes, which control inflorescence and floral organ development in Arabidopsis (Wang et al., 2004).
Domain analysis
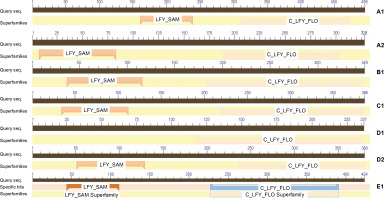
Motif search of protein sequences was conducted (Table 3), and it was found that the LEAFY protein sequences shared two domains, namely N-terminal Sterile Alpha Motif (SAM_ LFY) and C-terminal DNA binding domain (C_LFY_FLO) (GenomeNet bioinformatics tool). The result was confirmed using the CDD database (NCBI) web server (Fig. 2). The SAM domain mediates LFY oligomerization that helps to access low-affinity binding sites or closed chromatin regions (Sayou et al., 2016), and the biochemical properties of SAM domains are conserved throughout the evolution of all plant species. The crystal structure of the LFY- DNA binding domain resembles that of helix-turn-helix proteins and dimerizes on DNA, which triggers major developmental switches in plants (Hamès et al., 2008). The domains bind to short stretches of DNA called transcription factor binding sites (TFBS) that regulate gene expression. Domain analysis reported two domains of LEAFY proteins in all model organisms, except in fern species. In ferns, it was noted that only the C-terminal C_LFY_FLO, DNA binding domain is in partial confidence with other LEAFY protein sequences screened. The Pfam report in CDD revealed that these development LEAFY proteins are homologs of floricaula (FLO) and LEAFY (LFY), which function in floral meristem identity (Table 4). A mutation in these protein sequences affected the flower and leaf formation (Weigel et al., 1992; Hofer et al., 1997; Grandi et al., 2012; Monniaux et al., 2017).
Table 3
Domain and functional analysis of LFY/LEAFY homologous using motif find server
Table 4
Details of LEAFY protein sequences
Analysis of sequence similarity
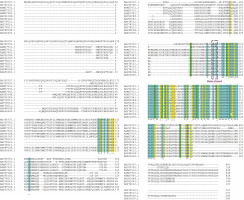
Multiple sequence alignment methods align and compare DNA, RNA, or protein sequences for evolutionarily relatedness. The aligned sequences provide valuable information regarding the structural, functional, and evolutionary history, often leading to a common ancestor (Edgar and Batzoglou, 2006; Chatzou et al., 2016). LFY primary sequences were aligned using the Clustal Omega [CLUSTAL O (1.2.4)] program to find the conserved region(s). The sequences were aligned by inserting a gap or space into the sequence to extend to the same length after alignment (Wang and Jiang, 1994; Tran and Wallinga, 2017). Charophyte green algae shared 38–46% sequence similarity with Physcomitrella sp., 37–46% similarity with Ceratopteris sp., 33–41% similarity with Picea sp., and 32–38% similarity with Arabidopsis sp. Fifty conserved (similar amino acid sequences), 22 conservative mutated (mutation results in the replacement of amino acid with a similar biochemical property), and 9 semi-conservative mutated (mutation results in the replacement of amino acid with a similar shape but dissimilar biochemical property) amino acids were identified from the sequence alignment of LEAFY proteins. In Arabidopsis sp., in conservative mutated amino acid sequence, aspartic acid (D) was replaced with histidine (H) at position 296 and alanine (A) was replaced with serine (S) at position 343, while in semi-conservative mutated amino acid sequence, histidine was replaced with tyrosine (T) at position 262, which were different from the respective amino acid sequences in the other non-flowering plant species tested (Fig. 3).
Fig. 3
Multiple Sequence Alignment of FLO_LFY protein sequences of length 237, 348, 349 and 424 residues obtained using Clustal Omega; (*) – denotes conserved sequence which is highlighted in blue, (:) – denotes conservative mutation which is highlighted in yellow [variation in sequence marked in red], (.) – denotes semi-conservative mutation which is highlighted in green [variation in sequence marked in red] and ( ) – denotes non-conservative mutation
LFY orthologs are found in all land plants, and the LFY gene performs various functions in multiple species as it evolves after gene duplication events (Silva et al., 2016). LFY homologs are involved in regulating cell division, and expansion and arrangement in free-sporing land plants such as ferns or fern allies and bryophytes. They also regulate both floral identity and cell division in gymnosperms and angiosperms (Moyroud et al., 2010).
Physicochemical properties of LEAFY proteins
The physicochemical properties of proteins influence their affinity, interaction, and adaptability to a biological system (Panda and Chandra, 2012; Dhar et al., 2020). Physicochemical characterization of the amino acid sequence includes MW, pI, II, AI, and GRAVY (Kaur et al., 2020), which were estimated using Expasy’s ProtParam (Table 5). This comparative analysis helped us to identify the occurrence of diversity of LFY protein sequences across Charophyte green algae, Physcomitrella sp., Ceratopteris sp., Picea sp., and Arabidopsis sp. pI is the pH value at which there are no net charges on the protein, and the protein remains stable without migration in the electric field and remains firm and stable at this pI. pI is crucial in protein separation and characterization (Pergande and Cologna, 2017). The pI of the LEAFY protein was lower and acidic for Arabidopsis sp., Physcomitrella sp., and K. subtile, whereas it was higher and alkaline for Coleochaete scutata, Ceratopteris sp., and Picea sp. II reveals the stability of the protein in both in vivo and in vitro conditions. The II value above 40 indicates that the protein is unstable, while the value below 40 indicates that it is stable (Guruprasad et al., 1990; Gamage et al., 2019). Our findings reveal that the II value of LEAFY proteins ranged from 39.58 to 62.51, which indicates that the structure of proteins is unstable. The AI index is essential to determine the thermal stability potential of the amino acid sequence, and thermal stability increases with a higher AI value (Panda and Chandra, 2012). The AI of LEAFY proteins ranged from 62.57 to 74.87, which indicates that the protein is thermally stable at a wide range of temperature (20–45 °C) (Enany, 2014; Ikai, 1980). Similar to stability studies, it is essential to evaluate the hydrophobic and hydrophilic nature of proteins by using the GRAVY score. The negative GRAVY value indicates that the protein is hydrophilic, and a positive value indicates they are hydrophobic; the value usually ranges from –2 to +2 (Kyte and Doolittle, 1982; Kaur and Pati, 2018). The GRAVY score of the LEAFY proteins for all model organisms was negative, which indicated a high number of interactions with water.
Table 5
Physicochemical characterization of LEAFY proteins in the ProtParam tool
Secondary structure prediction and analysis
Secondary structure formation is the initial step in protein folding to attain its functional shape (Pirovano and Heringa, 2010). The most accurate and reliable prediction of protein sequence structure is a challenging aspect of computational biology. The PHYRE2 program uses homology modeling techniques that help in structure prediction, function prediction, domain analysis, and mutation analysis (Kelley et al., 2015). As an essential step in the prediction of tertiary structures, PHYRE2 was first used for determining secondary structures such as an alpha helix, beta-strands, and irregular coil regions in the polypeptide chain of amino acids, which determine protein activity, interactions, and functions at the molecular level (Kelley et al., 2015). Homologous sequences for the LEAFY protein of each model organism (query sequence) were detected from multiple sequence alignment using PSI-Blast from the PHYRE2 server. The secondary structure prediction and disorder region prediction was made by Psi-Pred and Diso-Pred programs. In the predicted secondary structures of LFY proteins, it was found that the percentage of alpha-helix (α) structure ranged from 58 to 72% and that of beta-strands (β) ranged from 0 to 4% (Table 6). Proteins with alpha-helix (α) ≥ 40% and beta-strands (β) ≤ 5% were categorized as alpha protein class (Chou, 1995). Thus, these secondary structures belong to alpha protein classes. In alpha helices and beta strands, the potential to tolerate mutation differs significantly. Helices are more robust to mutation than strands or coils due to the noncovalent interactions of residues in the secondary structure units without a structural change (Abrusán and Marsh, 2016). The contact density among residues determines the acceptance of mutation without destabilizing the protein fold (England and Shakhnovich, 2003; Shakhnovich et al., 2005; Nemtseva et al., 2019). Thus, mutations result in lesser structural change.
Table 6
Secondary structure prediction of LEAFY proteins using the PHYRE 2 programme
The protein region without a secondary structure is a disordered region that affects the 3D structure of a protein. The disordered region binds with the partner molecule (nucleic acid, another protein, etc.) and thus exists as a structured protein (Dyson and Wright, 2005; Ishida and Kinoshita, 2008; Uversky, 2019). It often plays a functional role and is commonly involved in transcription, translation, and cell signaling (Van Der Lee et al., 2014; Hsu et al., 2020). Mutations in the disordered regions result in inappropriate protein folding (Uversky et al., 2005; Dyson, 2011); thus, the prediction of disordered regions is pivotal for the structure and function analysis of a protein sequence. The Diso-Pred server predicted the presence of 31% to 58% disordered regions in the tested LEAFY homologs, with the highest value found for C. thalictroides and the lowest value for P. patens, indicating that the LEAFY homolog is dynamic in the fern C. thalictroides and stable in the moss P. patens (Table 6).
Homology modeling
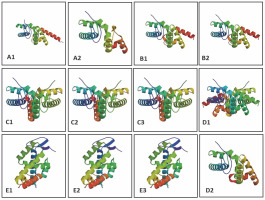
The determination of three-dimensional structure is essential as it provides insights into biochemical functions and protein interactions (Ittisoponpisan et al., 2019). The model was constructed by identifying sequence similarity (homologous sequence) with a target sequence and alignment with a suitable template from PDB (Fiser, 2010). The protein model was constructed using SWISS-MODEL based on the sequence and alignment with the most appropriate structural template for the LEAFY protein of model organisms from the PDB database, with GMQE and QMEAN Z-score values (Biasini et al., 2014). GMQE (Global Model Quality Estimation) estimates the model’s accuracy and is expressed as a number between 0 and 1. The QMEAN Z-score reports the reliability of the model quality estimation, and a QMEAN Z-score of around 0 indicates a good quality model (Benkert et al., 2011; Biasini et al., 2014; Waterhouse et al., 2018). Protein structure with a sequence homology of > 40% shares similarity with other protein structures, whereas sequence homology < 25% results in significant structural differences. Thus, a reliable protein structure cannot be predicted based on homology modeling when sequence homology is < 25% (Venclovas, 2011). Here, 32 template matches of the LEAFY protein (target sequence) for K. subtile and 43 template matches for Arabidopsis sp. were reported, in which the best and highest sequence similarity was reported for the template 2vy2.1A, which is the LEAFY protein structure of A. thaliana complex with DNA from Ag – I promoter (Hamès et al., 2008). Twenty-eight templates match of the LEAFY protein for C. scutata, 50 templates match for Physcomitrella sp., 8–9 templates match for Ceratopteris sp., 30 templates match for P. abies, and 50 templates match for P. sitchensis were reported, in which the best and highest sequence similarity was reported for the template 4bhk.1. A FLORICAULA/LEAFY HOMOLOG 1 codes for the transcription factor LEAFY in mosses, which interacts with DNA (Sayou et al., 2014) (Table 7). The 3D models for the LEAFY protein in each model organism were constructed based on the template, represented by rainbow color from N-terminal to C-terminal (Fig. 4).
Table 7
Template identification results for each LEAFY protein sequence in the SWISS-MODEL tool
Fig. 4
Constructed 3D models of LEAFY protein: A1 – Klebsormidium subtile, A2 – Coleochaete scutata, B1–B2 – Physcomitrella patens, C1 – Ceratopteris thalictroides, C2 – Ceratopteris richardii, C3 – Ceratopteris pteridoides, D1 – Picea abies, D2 – Picea sitchensis, E1–E3 – Arabidopsis thaliana using SWISS-MODEL (represented in rainbow colour from N → C)
Structure evaluation
The structural validation of the predicted protein models is crucial as the predicted structures may contain substantial errors. Because the structure is related to function, the generated model should be error-free. The structure evaluation was conclusively performed by Ramachandran plot analysis (Carugo and Djinović-Carugo, 2013). The MolProbity tool was accessed with the PDB files of protein structures for Ramachandran analysis, which helps to determine the protein geometry (Chen et al., 2010). Ramachandran plot generates the graphical representation of the allowed and forbidden regions of torsion angles, phi (φ) and psi (ψ), by plotting phi (φ) on the x-axis and psi (ψ) on the y-axis. Torsion angles of amino acid residues in the protein structure form secondary structures corresponding to the allowed and disallowed regions (Saravanan and Selvaraj, 2017). The dark-colored region in the Ramachandran plot is considered as the most favorable, the light-colored region as favorable, and the white region is disallowed and regarded as forbidden in the four quadrants of the Ramachandran plot structure. The four-quadrant plot helps in analysis of possible combination of torsion angles of the proposed protein. An optimal quality structure contains all the combinations of torsion angles in the allowed region, whereas if all sets of torsion angles occupy a forbidden region, it reflects a poor-quality homology model, resulting in steric hinderance (Røgen, 2021). The conformation of phi-psi torsion angles of the predicted LEAFY protein structure was satisfactory, as > 96% of all residues were present in the allowed region (Table 8), indicating a good quality model. There were no outliers in the Ramachandran plot for all the plant species, except for C. scutata (Fig. 5); thus, it can be considered as a good quality model suitable for further application (Muhammed and Aki Yalcin, 2019).
Table 8
MolProbity results of 3D models of LEAFY protein generated after structure assessment
Fig. 5
Ramachandran plot analysis of protein model of: A1 – Klebsormidium subtile, A2 – Coleochaete scutate, B1–B2 – Physcomitrella patens, C1 – Ceratopteris thalictroides, C2 – Ceratopteris richardii, C3 – Ceratopteris pteridoides, D1 – Picea abies, D2 – Picea sitchensis, E1–E3 – Arabidopsis thaliana
Conclusions
The present study revealed that LFY genes are conserved in Charophyte green algae, moss, fern, gymnosperms, and angiosperms. Domain analysis showed that the LEAFY proteins in all plant species shared two conserved domains, namely C_LFY_FLO and SAM_LFY. The physicochemical characterization reported that the LEAFY protein has an unstable structure, indicating its dynamic nature. The protein is thermally stable and hydrophilic in nature. In LEAFY protein sequences, most conserved, conservative mutated, and semi-conservative mutated sequences were predicted as helical structures. Beta strands were conserved in all plant species with only sequence differences in charophyte green algae, which is a unique variation in LFY evolution. The 3D models generated from the LEAFY protein sequences were of good quality and will help to corroborate structural and functional analysis. The results of phylogenetic analysis indicated a very early mutation that led to the formation of two distinct clusters, one leading to angiosperms and the other to gymnosperms. The LFY gene of the gymnosperms showed homology with that of mosses and pteridophytes as compared to that of orchids, monocots, and other flowering plants.


