Introduction
Mitochondrial diseases (MD) are a heterogeneous group of disorders resulting from a damaged function of the mitochondrial respiratory chain and impaired ATP production in the process of oxidative phosphorylation. Mitochondrial diseases are rare diseases but their total incidence is 1.6 : 5000 of live births, which makes them the most common diseases among inherited metabolic disorders [1,2]. The clinical picture of MD is highly varied. The disease may be manifested at any age and virtually each organ may manifest little specific symptoms. The most common symptoms are related to high-energy organs: central nervous system (encephalopathy, seizures, stroke-like lesions, psychomotor developmental delay), skeletal muscles (myopathy, exercise intolerance), sensory organs (sensory-neural hearing loss, optic nerve atrophy, ptosis, external ophthalmoplegia), but they may also involve the heart (hypertrophic cardiomyopathy, arrhythmia), with possible endocrine disorders or gastrointestinal symptoms [3,4]. These diseases may be related to an abnormal variant in mitochondrial DNA (mtDNA) or nuclear DNA (nDNA). Up to now, over 400 genes responsible for MD have been recognised [1,3,5].
Due to a very high heterogeneity of clinical phenotypes occurring even in subjects with damage to the same causative gene, clinical evaluation of MD patients should be based on various clinical scales (i.a. the International Paediatric Mitochondrial Disease Scale, IPMDS) [6], as well as specific biomarkers (i.a. FGF21). The scale includes a subjective assessment (problems reported by guardians), physical examination with elements of neurological examination, and a functional assessment. It is used to assess MD severity and stage in children (0–18 years), and it may also be used to assess MD progression [6–8].
FGF21 has been shown to be a sensitive and specific biomarker of MDs, especially those with skeletal muscle involvement [9–11]. The increased FGF21 concentration in MD is correlated with impaired oxidative phosphorylation and reduced ATP production, which means metabolic stress to the cells, to which they respond with FGF21 production [12,13].
FGF21 may also be used as a marker of the MD stage; higher and gradually increasing concentrations have been observed in subjects in the final stage of the disease and with higher damage to skeletal muscles (FGF21 concentration was correlated with a higher percentage of COX-negative fibres in the muscle biopsy) [9,14,15].
The study objective was to verify if the FGF21 concentration in paediatric patients with mitochondrial disease was correlated with the disease severity and stage.
Material and methods
Paediatric patients with a probable, or molecularly confirmed mitochondrial disease were enrolled in the study. MD probability was assessed with the use of the Nijmegen scale (subjects with a score higher than 4 were included in the study group) [16,17]. Molecular tests were performed depending on clinical preconditions: MLPA analysis and/or Sanger sequencing of selected mtDNA fragments or an authorial NGS (Next Generation Sequencing) panel for identification of known mitochondrial diseases depending on the presence of nDNA/mtDNA changes or for identification of common point mutations and long-range mtDNA rearrangements.
Each MD patient was assessed by researchers using IPMDS according to the guidelines shared by the scale authors [7]. The result is given as the percentage of the score that may be achieved by a given patient. The patients were assessed in 3 domains, the scores were added and the total value was calculated (IPMDS total). The patients with the IPMDS total < 10% were qualified as mild MD phenotype (group A), IPMDS total = 10–19,9% were qualified as moderate severity MD (group B) and with IPMDS total ≥ 20% – as severe MD (group C).
The control group comprised of children without obesity (BMI < 95th pc for age and sex), without signs of liver dysfunction, nephropathy or circulatory insufficiency (since these are known conditions with potentially elevated FGF21). Among the control group: 7 were healthy children (mainly siblings of study patients), 5 – patients with delayed psychomotor development, without confirmed inborn error of metabolism (IEM), 8 – had drug-resistant epilepsy (5 with molecularly confirmed IEM: SLC2A1, MOCS2, GLUL, ADSL) and 1 – optic nerve atrophy (without IEM).
FGF21 was analysed in plasma samples using the BioVendor Human FGF-21 ELISA (BioVendor – Laboratorní medicína a.s., Brno, Czech Republic). Together with FGF21, plasma concentrations of conventional biomarkers lactate (LA), pyruvate (PA), alanine and creatine kinase (CK) were measured.
Statistical differences were determined using Kruskal–Wallis and ANOVA non-parametric tests for data with no normal distribution (FGF21 concentration) and ANOVA parametric test – for data whose distribution was no different from the normal distribution (IPMDS). A p-value of < 0.05 was considered statistically significant. Correlations were assessed with Spearman’s correlation test.
The study was approved by the Committee for Medical Research Ethics of Children’s Memorial Health Institute in Warsaw (No: 40/KBE/2019), and written consent was obtained from all patients/ parents of patients.
Results
Thirty-two patients with MD and 21 children without MD were assessed. The median age in the study group and in the control group was 33 (2–213) and 42 (8–202) months, respectively. The clinical characteristics of the study group are presented in Table I. In 6 (18.7%) patients the molecular cause of MD was not identified, in 3 patients the diagnosis was made on the basis of selective screening – testing relatives (in those patients the Nijmegen score at diagnosis was < 4).
Table I
Characteristics of patients with MD
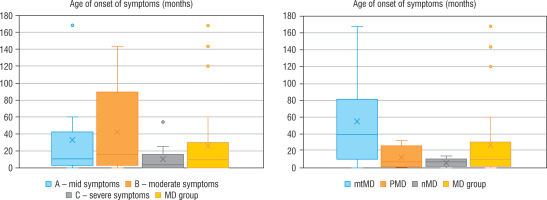
Regarding severity of mitochondrial disease, assessed using IPMDS, patients with MD were divided into 3 groups. In group A (n = 10), with the least severe symptoms, the patients were older than in the other groups (group B – with moderate severity, n = 9), or group C (severe MD phenotype, n = 13), whereas in group C the disease had the earlies onset – the data are presented in Figure 1. In patients from groups A and B epileptic seizures were less frequent (epilepsy was diagnose in 3/10 and 1/9 patients, respectively) than in group C, where seizures occurred in 6/13 patients, although the correlation was not statistically significant. Developmental delay was significantly more frequent in patients with a more advanced disease. In groups A, B and C it was observed in 4/10, 7/9 and 13/13 subjects, respectively.
Figure 1
Age of onset of symptoms in each groups
MD - patients with mitochondrial disease; mMD - patients with mtDNA genetic defects; PDNA - patients with PDHA1; nMD - patients with nDNA genetic defects

Table II
Clinical and biochemical data of the studied groups according to the severity of the disease and molecular cause of the disease
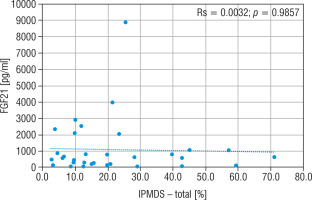
The concentration of FGF21, lactic acid, pyruvic acid, alanine, and creatine kinase in particular groups are shown in Table II. The FGF21 concentration in the study MD group was significantly higher (p < 0.01) than in the control group (576.5 vs 30.9 pg/ml), and the cut-off point for MD FGF21 (> 95th pc) was 266 pg/ml. Similarly, the concentration of LA (34.2 vs 13.9 mg/dl), PA (1.4 vs 0.9 mg/dl) and the lactic acid to pyruvic acid ratio (LA/PA) (20.1 vs 13.3) were higher in the group with MD. No significant correlation was observed between MD stage measured by IPMDS and the FGF21 concentration (Rs = 0.0032, p = 0.9857) (Fig. 2). LA and PA concentrations were the highest in group C with the severe MD phenotype, and the lowest in patients with mild symptoms (group A). The difference, however, was not statistically significant. No such correlations were observed for other MD biomarkers, such as LA/PA ratio, serum alanine or CK.
Figure 2
Correlation analysis between FGF21 and IPMDS in all MD patient groups
IPMDS - the International Paediatric Mitochondrial Disease Scale; FGF21 - fibroblast growth factor 21; MD - patients with mitochondrial disease

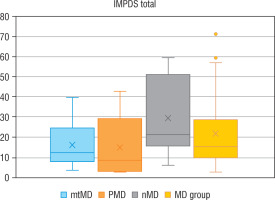
Genetic diagnosis could not be made in 6 patients with MD. In 10 patients an abnormal variant was found in mtDNA (mtMD group) in genes: MT-TL1 (n = 4), MT-ATP6 (n = 2), MT-TK1 (n = 1), MT-ND3 (n = 1), MT-ND5 (n = 1), MT-ND6 (n = 1); in 7 patients an abnormal variant was found in PDHA1 gene (group PMD), and in 9 patients in other nDNA genes (group nMD): SURF1 (n = 2) and in the following genes damaged in one patient each: SCL19A3, SLC25A12, COQ8A, EARS2, FLBX4, NDUFS1, NUBPL. Biochemical data for particular groups of patients are shown in Table II. Patients in nMD and PMD groups were younger (the median age was 16 and 40 months, respectively) and showed an earlier onset of the disease (median age: 6 months in both groups) than patients with mtMD damage (median current age: 100 months, median first symptoms: 40 months). Patients from group nMD had a more advanced disease (IPMDS total = 21.4 %) as compared to PMD (IPMDS total = 8.6%) and mtMD patients (IPMDS total = 12.5%), but the difference was not statistically significant (p = 0.1190) (Figure 3). The FGF21 concentration was the highest in group nMD (median FGF 21 = 1022.0 pg/ml) and the lowest in PMD patients (median FGF 21 = 28.2 pg/ml), and the difference was significant (p < 0.05) (Fig. 4). In patients with disorders of mitochondrial translation, including abnormal variants in mitochondrial tRNA (MT-TL1, MT-TK, EARS2, FBXL4) FGF21 concentration was higher (median FGF21 = 2317 pg/ml, range: 751–8873) than in patients with abnormal genetic variants responsible for the subunit structure of the respiratory chain (MT-ND3, MT-ND5, MT-ND6, MT-ATP6, SURF1, NDUFS1, NUBPL) (median FGF21 = 413 pg/ml, range: 106–1022).
Figure 3
IPMDS – total in particular groups
IPMDS - the International Paediatric Mitochondrial Disease Scale; MD - patients with mitochondrial disease; mMD - patients with mtDNA genetic defects; PDNA - patients with PDHA1; nMD - patients with nDNA genetic defects

Figure 4
Serum FGF21 – total in particular groups
FGF21 - fibroblast growth factor 21; MD - patients with mitochondrial disease; mMD - patients with mtDNA genetic defects; PDNA - patients with PDHA1; nMD - patients with nDNA genetic defects; *p < 0.05

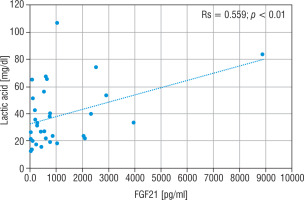
The LA concentration was also the highest in the group of nMD patients (median: 42.5 mg/dl). The PA concentration was the highest in group PMD (median PA = 1.7 mg/dl), and this group had the lowest LA/PA (median LA/PA = 14.5) – which results from biochemical specification of the disease. There was a slight correlation between FGF21 and the concentration of LA, LA/PA and serum alanine in MD patients (Figs. 5–7).
Figure 5
Correlation analysis between FGF21 and LA serum levels in all MD patient groups
FGF21 - fibroblast growth factor 21; MD - patients with mitochondrial disease; LA - lactic acid

Discussion
FGF21 is a protein produced primarily by the liver in response to the state of prolonged fasting. Its expression is also demonstrated in other tissues, e.g. in the adipose tissue, skeletal muscles, pancreas, cardiac endothelial cells, or in the hypothalamus [12]. An increased FGF21 concentration was observed in various conditions related to metabolic stress (e.g. after prolonged exercise), but also in quite common diseases – e.g. non-alcoholic fatty liver disease, obesity, undernutrition, insulin resistance, coronary heart disease, or nephropathy [12,18,19]. Its concentration is not correlated with age or sex [9,20,21]. Also, there is no correlation between the FGF21 concentration and liver dysfunction [9,20,21]. FGF21 sensitivity and specificity to mitochondrial myopathies has appeared to be higher than that of other known biochemical markers, such as: serum lactic acid concentration, serum lactic acid to pyruvate ratio, assessment of serum alanine concentration [9, 14, 20, 22, 23]. FGF21 has appeared to be a more sensitive index than muscle biopsy; a significant increase in the FGF21 concentration has been observed in patients with mitochondrial disease confirmed by a molecular examination, in whom muscle biopsy did not show changes [24].
In the presented study, FGF21 has appeared to be a sensitive and specific MD marker. The usefulness of this protein, as new biomarkers for MD diagnosis has been shown by numerous study [9, 10, 14, 20, 25–27] and confirmed by meta-analysis [22]. FGF21 sensitivity in the meta-analysis referred to was: from 0.51 to 0.93 (I2 91.26%, 95% CI: 85.23–97.29) and from 0.77 to 0.97 for specificity (I2 66.31%, 95% CI: 34.06–98.57) across the five studies, with a total of 718 participants (339 patients and 379 healthy controls) [22]. A cut-off point (> 95th pc) for the MD concentration (vs healthy control) given in the literature is from 180 to 400 pg/ml, and the values were several/several dozen times higher (2.2–13 times) than in the control group [9–11, 14, 20, 21]. Similar data have been achieved in the present study.
FGF21 have turned out to be more sensitive and specific than other known biomarkers MD (LA, PA, LA/PA, CK, or serum alanine) [21, 26, 28]. No correlation has been found between FGF21 and the other MD markers [21, 26], the opposite data result have been achieved in the conducted study, but it was a slight correlation. FGF21 have been suggested to be used for monitoring of MD treatment [21, 26, 29].
There are no consistent data, however, showing a correlation between MD stage and the concentration of FGF21. Yatsuga et al. [27] showed a positive correlation of FGF21 with the disease stage in the group of 48 patients with MD, (median age: 33.6 ±18.7 years) with a different phenotype and genotype. Similar data were achieved by Koene et al. [30] in the assessment of adult patients with a common pathogenic variant in mtDNA m.3243A>G. Davis et al. [10] did not achieve such a correlation in a group of adults with MD (different disease phenotype and genotype) – no higher FGF21 concentrations were observed in subjects with a more advanced MD. The present study has also showed no such correlation in paediatric patients with a different disease phenotype and genotype – the FGF21 concentration was not higher in children with more severe symptoms of MD.
There are no consistent data that would show an increase in FGF21 with MD progression. In their study on mice, Tyynismaa et al. [15] observed that FGF21 was increasing together with the progression of muscle disease in animals with mtDNA deletion and respiratory chain deficit. Soumalainem et al. [9] observed increasing values of FGF21 in several MD patients who at the same time showed an increase in the severity of clinical symptoms. Similarly, Maresca et al. [28] recorded significantly higher FGF21 concentration in 4 patients with MD during a stroke-like episode (SLE), as compared to the concentration from before the disease exacerbation. On the other hand, Koene [30] did not observe increasing FGF21 concentrations during a 24-month follow-up of patients with MD caused by m.3243A>G change.
Numerous studies have demonstrated high FGF21 concentrations in mitochondrial depletion syndromes [14, 20, 21] and in disorders of mitochondrial translation, including abnormal variants in mitochondrial tRNA [20, 21, 25, 28]. In 26 adult patients with MD, higher FGF21 concentrations were observed if the disease was caused by an abnormal variant in mtDNA (in MD caused by a single mutation in mtDNA (FGF21 = 730 pg/ml) and mtDNA deletion (FGF21 = 1172 pg/ml), respectively, in comparison with subjects whose MD resulted from an abnormal variant in nDNA (FGF21 = 401 pg/ml), but the difference was not statistically significant [25]. Similar data were achieved by Maresca et al. [28] in a group of MD adults n = 123: significantly higher FGF21 values were observed in patients with abnormal mtDNA variant, especially in patients with MELAS and MERRF phenotypes. In paediatric patients [21], however, an inverse correlation was observed – lower FGF21 concentrations occurred in children with MD caused by a change in mtDNA (n = 24; median: 147 (30–4300) pg/ml), as compared to the children whose disease resulted from a change in nDNA (n = 24; median: 362 (30–6200 pg/ml). Similar observations follow from the present paper. There is too little research to explain this finding. It is known that in children MD more often results from an abnormal variant in nDNA, while in adults it results from mtDNA [3, 31], where the most frequently described change is m.3243A>G, in which high levels of FGF21 are observed [28, 31]. Early onset of MD is also associated with a worse prognosis and a more severe course, which may be the reason why FGF21 levels are higher in paediatrics patients with a pathogenic nDNA variant than in children with mtDNA alteration. The lowest levels of FGF21, often below the cut-off point for MD, were observed in patients with an abnormal variant responsible for the structure of the respiratory chain subunits [14, 20]. An interesting fact is that children with an abnormal variant in the PDHA1 gene show often normal values of the above parameters (in 4/ 5 patients they were < 95th pc) [21]. Our observations are similar: in the group of 7 children with a change in the PDHA1 gene, the FGF21 concentrations were lower than in other MD patients, and in 5/7 patients FGF21 was < 95th pc.
Conclusions
The FGF21 concentration is significantly higher in paediatric patients with MD than in children without MD. There is no correlation between the stage of MD and FGF21 concentration. Higher FGF21 values are seen in patients whose MD results from an abnormal nDNA variant rather than mtDNA damage, whereas lower values, often below the MD cut-off point, are seen in the deficit of pyruvic acid dehydrogenase.

 ENGLISH


