


Introduction
The management of allergic diseases is a serious challenge in the practice of a pediatrician. Over the last dozen or so years, there has been a noticeable increase in the incidence of allergic diseases. Depending on the route of entry of the allergen into the body, airborne (inhalation) allergy, contact allergy and food allergy are distinguished airborne (inhalation) allergy, contact allergy and food allergy. The incidence of allergic reactions to food products has been steadily increasing around the world in recent decades. Currently, this problem affects approximately 5% of adults and 10% of children worldwide. In Poland, over 20% of the pediatric population suffers from the disease [1]. The factors that may cause them also include environmental conditions, such as the increasing level of air pollution, tobacco smoke and the presence of exhaust gases and other environmental allergens that may interact with the human genome [2, 3].
A food allergy is a hypersensitivity reaction to a specific food antigen. It can cause stress, anxiety and even depression in parents and affects the family’s quality of life. An allergic reaction can virtually occur in response to any potential antigen. Currently, it is estimated that it can be caused by up to 160 different foods. However, the most common allergenic foods, the so-called the big eight, include: cow’s milk, eggs, cereals, soy, fish, mollusks and crustaceans, nuts. Food hypersensitivity may also occur after exposure to vegetables and fruits. The most common allergenic antigens in infants and children are chicken egg and cow’s milk proteins, which are responsible for up to 90% of allergic reactions at this age [4–6]. In Poland, approximately 2.5–3% of children under 3 years of age are allergic to cow’s milk proteins [1].
The impact of the state of the natural environment on the development of allergic diseases is a very complex problem. This is primarily due to changes in the environment caused by air pollution. It negatively affects the development and life of plants, animals and humans and threatens the global climate system. Air pollution is any substance introduced by humans, directly or indirectly, into the surrounding air, which is likely to have a harmful effect on human health or the environment as a whole. The concentration of air pollutants depends on various factors, such as the season, weather conditions (temperature, precipitation, winds) and the increase in the activity of emission sources. Chemical compounds introduced into the atmospheric air cause allergies. The impact of air pollution on breathing difficulties results from, among others, the content of various impurities, including nitrogen oxides. The greatest threat is caused by nitrogen dioxide produced during the combustion of fuels at high temperatures, mainly in car engines and power plant furnaces. With chronic exposure, it causes inflammation of the respiratory mucosa, increases the susceptibility of the respiratory system to infections and causes conjunctival irritation [7–9].
Another major problem is the emission of pollutants from road transport, which depends mainly on the type of vehicle (lorry, passenger car), chemical composition of the fuel, engine type, degree of wear and engine load. People who are susceptible to various types of allergies include: diesel exhaust particles. The gas phase of exhaust gases includes, among others: CO2, SO2, NOx and substances affecting the formation of ozone. These are typical substances that irritate the skin, eyes or respiratory system [9].
The problem of air pollution occurs in urban and industrial agglomerations, including the city of Bielsko-Biala, where the number of toxic compounds is much higher than in open areas. It is characterized by a specific microclimate related to the nature of the buildings, green areas, traffic intensity, industrial and heating pollution. The atmosphere of cities is currently on average 1–2°C higher in temperature. There are more foggy and cloudy days in cities, which significantly affects the air quality [10, 11].
Air pollution from road traffic and other human activities not only has a direct negative effect on human health but also enhances the allergenicity of some plants. Since the beginning of the industrial revolution, Western countries have experienced a rapid urbanization process that has dramatically impacted environmental exposure. As a result, over 90% of the population lives in places where the air quality does not meet the recommendations of the World Health Organization (WHO). Most urban residents are exposed to concentrations of fine particulate matter (PM2.5) and particulate matter ≤ 10 mm in diameter (PM10) that exceed WHO recommendations [12].
Various epidemiological studies have shown that long-term exposure to air pollutants (e.g. from road traffic, industry) negatively affects respiratory health. A multicenter study in five European birth cohorts (conducted as part of the European Study of Cohorts for Air Pollution Effects, ESCAPE project) found that exposure to nitrogen dioxide, particulate matter PM2.5 and PM10, and benzo(a)pyrene was associated with poor lung function in school-age children and the occurrence of food and skin allergies in them [13].
The environment acts on the genome inducing epigenetic changes, which function as important effectors of external insults. Epigenetic modification induces alterations in the DNA structure leading to changes in gene expression and inducing downstream disease. Some air pollutants interact with plants and fungi, increasing pollen production and allergenicity. Pollution can also promote the release of allergens by directly damaging cells. Pollen grains and fungal spores contain several bioactive compounds that may exert pro-inflammatory and pro-allergic effects. Recent data suggest that several pollen-associated lipid mediators (PALM) activate Th2 cells to promote IgE synthesis in vitro. Pollen collected along heavily trafficked roads released larger amounts of PALM. Similarly, a study conducted in Germany showed that birch trees exposed to higher concentrations of air pollutants produce more birch allergen (Bet v1) and PALM per pollen grain than ozone-free trees. A skin prick test performed with an allergenic extract obtained from trees heavily exposed to pollen resulted in a significantly larger wheal diameter in AR patients compared to trees less exposed to birch pollen [14].
Contact dermatitis includes all types of skin lesions that occur as a result of direct contact with a chemical, physical agent or allergen. Contact dermatitis is a common dermatosis, very often diagnosed in both children and adults. Allergic contact dermatitis is an inflammatory skin disease that accounts for between 20% and 25% of all cases of dermatitis in children [15–17].
Due to the type of mechanism by which the disease develops, we can distinguish allergic contact dermatitis (ACD), in which the symptoms occur with the participation of the immune system, and irritant contact dermatitis (ICD) in which irritating factors directly damage the skin, and the symptoms are independent of the immune system.
Allergic contact dermatitis is also called allergic eczema. Symptoms of contact allergy appear as a result of skin exposure to haptens, i.e. simple small-molecule substances weighing less than 500 Da. Their particles easily penetrate even through intact epidermis. After entering the body, they combine with body proteins, creating the so-called immune complexes. Such structures are foreign to the immune system, but a properly functioning body should develop immunological tolerance to them. In allergy sufferers with an overactive immune system, the detection of such complexes in the body results in inflammation. Contact allergy occurs in 13–25% of children, and allergic eczema develops on average in 7–8% of children. Contact allergy is most often reported in children under 3 years of age, but contact eczema may also occur in infants. Allergic contact dermatitis in children is most often caused by metals, cosmetics, especially those containing fragrances and preservatives, lanolin, foaming detergents, neomycin, essential oils, as well as rubber ingredients and epoxy resins [16, 18].
Irritant contact dermatitis is also called toxic eczema. It is caused by exposure of the skin to irritating factors. They cause disturbances in the biophysical properties of the skin, such as changes in pH, water loss, microcirculation disorders, changes in elasticity and pigmentation. Chemical substances contained in polluted air directly damage the structure of the epidermis, from which inflammatory mediators are released. Local skin irritation reactions then occur without the involvement of the immune system. This type of disease is most often described in the context of an occupational disease because it is the cause of a significant number of cases of dermatoses reported by employees working with chemical substances on a daily basis. The likelihood of the disease occurring is increased by high frequency of exposure to the irritant, high concentration of the irritating substance and its ability to penetrate the epidermis. The individual susceptibility of the skin to irritation (e.g. disturbances in the integrity of the epidermal barrier, coexisting dermatoses, tendency to atopy) and environmental conditions are also important. Contact dermatitis due to irritation may be caused by chemical compounds (which are the most common cause of this condition), physical factors such as radiation (UV and ionizing), temperature (mainly low) and mechanical factors (friction, vibration, pressure) and airborne factors (steam, dust). The most powerful chemical compounds cause severe skin damage resembling burns in every person. They are called absolute irritants and include mainly concentrated acids, bases, some metals (nickel salts, mercury compounds) and organic compounds (e.g. solvents) [19–21].
Aim
The aim of the study is to determine the relationship between the level of selected atmospheric air pollutants in Bielsko-Biala in the years 2018–2022 (nitrogen dioxide, suspended dust PM2.5 and PM10 and benzo(a)pyrene) and the incidence of food and skin allergies among children and adolescents from 0 to 18 years of age.
Material and methods
Based on data from the Department of Health of the Silesian Voivodeship Office in Katowice, tables were prepared to illustrate the incidence of allergic contact dermatitis caused by substances introduced into the body (L 27) and allergic food inflammation of the stomach, small intestine and colon (K 52.2). Annual average concentrations of selected air pollutants, the Statistica program and Pearson correlation coefficients were also taken into account.
Results
The incidence of food and skin allergies is decreasing and is 164.4/10,000 in 2018 and 150.6/10,000 in 2022 for food allergies and 197.3/10,000 in 2018 and 181.1/10,000 in 2022 for skin allergies (Figure 1).
Figure 1
Incidence of children and adolescents aged 0–18 with food and skin allergies in 2018-2022 in Bielsko-Biala (incidence per 10,000). Dashed lines indicate the trends: blue line for allergic contact dermatitis and orange line for food allergies. Source: authors’ own study based on data from the Department of Health of the Silesian Provincial Office in Katowice
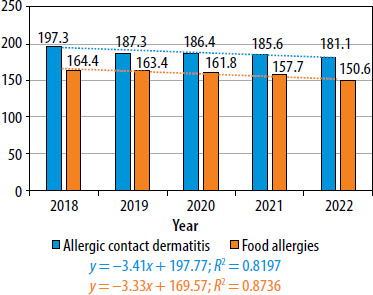
The linear regression analysis for the incidence of allergic contact dermatitis from 2018 to 2022 (blue line) shows a statistically significant downward trend. The regression equation is as follows: y = −3.41 x + 197.77. This means that the number of cases of allergic contact dermatitis decreases by an average of 3.41 cases per 10,000 people each year, indicating a systematic decline in incidence over the study period. The coefficient of determination R2 = 0.8197 indicates that the model explains 81.97% of the variance in the data, which suggests a good fit of the model to the actual trend. In terms of statistical significance, the p-values for both the slope (−3.41, p = 0.0344) and the intercept (197.77, p = 0.00008) are below the 0.05 threshold, meaning that both parameters are statistically significant. This confirms that the observed decline in the incidence of allergic contact dermatitis is not random, and the year-on-year change is highly likely to occur in the general population.
Similarly, the linear regression analysis for the incidence of food allergies from 2018 to 2022 (orange line) shows a statistically significant downward trend. The regression equation is: y = −3.33 x + 169.57. This indicates that the number of cases of food allergies decreases by an average of 3.33 cases per 10,000 people each year. The coefficient of determination R2 = 0.8736 indicates that the model explains 87.36% of the variance in the data, indicating a strong fit. The p-values for the slope (−3.33, p = 0.0198) and the intercept (169.57, p = 0.000006) are both below the 0.05 threshold, confirming the statistical significance of both parameters. This further supports the conclusion that the observed decline in the incidence of food allergies is not random, and the reduction in cases is likely to continue across the studied population.
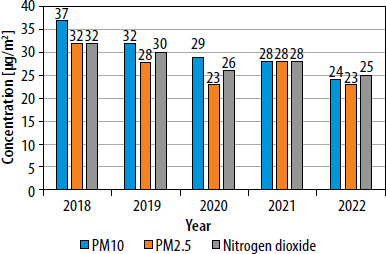
The average annual concentration of suspended dust PM10 in the years 2018–2022 decreased and ranged from 37 µg/m3 in 2018 to 24 µg/m3 in 2022. For nitrogen dioxide, the average annual concentration also decreased and amounted to 32 µg/m3 in 2018 and 23 µg/m3 in 2022. The average annual concentration of suspended dust PM2.5 was variable: the lowest value was 23 µg/m3 in 2020 and 2022 and the highest was 32 µg/m3. In 2019 and 2021, these concentrations were 28 µg/m3 (Figure 2).
Figure 2
Average annual concentrations of suspended dust PM10, suspended dust PM2.5 and nitrogen dioxide. Source: authors’ own study based on data of the Chief Inspectorate of Environmental Protection (GIOŚ)
In order to examine the relationship between the occurrence of food and skin allergies and air pollution, Pearson correlation coefficients were calculated using the Statistica program and their significance was then tested. There is a very strong positive correlation between the concentration of PM10 and the occurrence of the allergies in question. The Pearson correlation coefficient for allergic contact dermatitis and PM10 was 0.9656 (p = 0.008). The Pearson correlation coefficient for food allergy and PM10 was 0.8862 (p = 0.045). Therefore, in both types of allergies discussed, a very strong positive correlation was obtained, which means that a decrease in the PM10 value results in a decrease in the incidence of the considered allergic diseases. For the relationship between the PM2.5 concentration and the occurrence of the analyzed allergic diseases, statistically non-significant results were obtained, which may be due to the short observation period (5 years) and the fact that the average annual PM2.5 concentrations were still exceeded. However, a statistically significant result was obtained when examining the relationship between nitrogen dioxide and allergic contact dermatitis. The Pearson correlation coefficient in this case was 0.8820 (p = 0.048). In the case of examining the relationship between food allergy and nitrogen dioxide, the Pearson correlation coefficient was 0.7659 and p-value was 0.093. At the significance level of 0.05, the obtained result is not statistically significant, but with such a small sample, the risk of committing a type I error at the level of 10% can be accepted (increasing the significance level to 0.1). In such a case, the result will be statistically significant and indicates a strong positive correlation (Table 1).
Table 1
Correlations between suspended dust PM2.5 and PM10, nitrogen dioxide and skin allergies and food allergies. Source: authors’ own study
It can therefore be concluded that improving air quality (in particular decreasing PM10 and nitrogen dioxide values) contributes to reducing the incidence of allergic diseases.
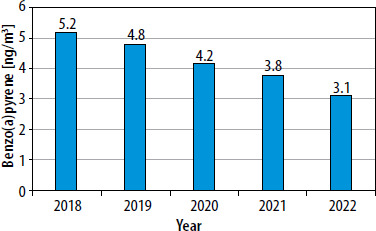
It is similar for suspended dust PM10 and nitrogen dioxide, the average annual concentration of benzo(a)pyrene is decreasing and ranges from 5.2 in 2018 to 3.1 ng/m3 in 2022 (Figure 3).
Figure 3
Average annual concentrations of benzo(a)pyrene. Source: authors’ own study based on data of the Chief Inspectorate of Environmental Protection (GIOŚ)
The relationship between the concentration of benzo(a)pyrene and the incidence of allergies, as for suspended dust and nitrogen dioxide, was also calculated using the Pearson correlation test. The Pearson correlation coefficient between the concentration of benzo(a)pyrene and the occurrence of skin allergies was 0.8884 (p = 0.044), and for food allergies it was 0.9535 (p = 0.012). Based on the presented coefficients, it can be concluded that in both cases the correlation is statistically significant, positive and very strong (Table 2). Therefore, as the concentration of benzo(a)pyrene decreases, we observe a decrease in the incidence of two types of allergies.
Discussion
The average annual permissible level of suspended dust PM10 and nitrogen dioxide, in order to protect human health, should not exceed 40 µg/m3, for PM2.5, this criterion is 20 µg/m3, and for benzo(a)pyrene, its average annual concentration should not exceed 1 ng/m3 – in accordance with Art. 89 of the Environmental Protection Law Act of April 27, 2001 (Journal of Laws of 2021, item 1973, as amended) [22].
For suspended dust PM10 and nitrogen dioxide, the average annual concentration was not exceeded in the period in question. With regard to both PM2.5 and benzo(a)pyrene, the average annual values were exceeded and for suspended dust they ranged from 12 µg/m3 in 2018 to 3 µg/m3 in 2022. With regard to benzo(a) pyrene, these values were also exceeded in each year and ranged from 4.2 ng/m3 in 2018 to 3.1 ng/m3, respectively. However, it should be emphasized that the average annual concentrations of PM2.5 and benzo(a)pyrene are/have been significantly decreasing (Figures 2, 3).
A significant association between exposure to air pollutants (benzene, PM10, nitrogen oxide compounds, and CO exposure) and eczema symptoms was revealed in a study of 9–11-year-old children in France [23]. In Taiwan, a survey involving over 30,000 children indicated that flexural eczema incidence was associated with exposure to traffic-related air pollutants (TRAP) [24]. A birth cohort study in an urban area showed strong positive relationships between the distance to the nearest main road and eczema, while NO2 exposure was positively associated with eczema incidence [25]. Outdoor air pollution influences the prevalence of AD. In a study involving 4907 children, the lifetime prevalence of AD eczema was demonstrated to be significantly associated with long-term average concentrations of PM10, nitrogen oxide compounds, and CO [26]. The results of a study conducted in Italy provide evidence that air pollution has a significant impact on skin reactivity and symptoms in AD patients, increasing its severity [27]. These studies suggest that outdoor air pollution is one of the most potent risk factors for the development of AD and it also affects the skin of AD patients [28].
Since 1987, the World Health Organization (WHO) has regularly published air quality guidelines to reduce human exposure to air pollution and its negative effects on human health. The 2005 WHO Global Update had a significant impact on pollution control policy around the world because its publication led to the development of the first universal reference framework, which mobilized both governments and civil society to increase efforts to control and study the effects of exposure to air pollution. Exceeding recommended air quality guideline (AQG) levels are significantly associated with numerous adverse human health consequences. Unfortunately, these guidelines are not legally binding standards, but are a science-based tool that WHO Member States can use in their legislative processes and policy implementation.
On September 22, 2021, WHO published new air quality guidelines, which contain certain recommendations (guidelines) relating to 6 pollutants for which data on their impact on health are best documented, i.e. suspended particles, ozone, nitrogen dioxide, sulfur dioxide and carbon monoxide [29]. The new recommendations are clearly more stringent than the previous ones (mainly average annual concentrations).
In the new WHO guidelines, the permissible level of suspended dust PM2.5 has been tightened twice in relation to the level specified in the WHO guidelines from 2005 and four times in relation to the standard applicable in Poland for the average annual concentration (Table 3).
Table 3
Comparison of WHO recommendations with the standards applicable in Poland regarding air quality. Source: data prepared on the basis of WHO
The analysis of the average values of the discussed air pollution concentrations indicates a favorable situation over the last few years. Actions aimed at reducing air pollution are intended to improve the quality and condition of our lives, and thus translate into savings in health care, reducing the incidence of particular diseases and improving the condition of the natural environment.