


INTRODUCTION
Soccer is an intermittent field sport containing both high- and lowintensity running efforts [1]. The monitoring of physical performance in elite soccer has developed in recent years with advancements in suitable player tracking technologies [2]. Accurately quantifying players’ match actions is required to improve the understanding of workloads during match-play [3]. When match-play physical demands are examined, load is often characterized by graduated speed thresholds ranging from motionless standing to maximal sprinting [4]. Player tracking has traditionally been reported using generic speed zones [5]. Currently, there is no consensus on the metrics that are most practically useful, specific and reliable [6]. For instance, a recent systematic review noted that there is a lack of uniformity to classify different speed thresholds which makes comparisons between studies or generalizations of results difficult [7]. Historically, generic speed thresholds have been applied to all squad athletes [8]. This allows the comparison of physical performance between players within and across teams and leagues to be conducted. However, these thresholds do not account for individual physical differences and the relative exertion imposed on the player to reach such generic speeds.
The disadvantages associated with generic speed thresholds have been documented, thus, researchers have attempted to individualize thresholds using physical performance markers [5, 9–11]. The aim of individualizing speed thresholds is to account for the individual nature of the exercise-intensity continuum and accurately represent the relative intensity of an athlete when performing [8]. Varying methodological approaches employed to individualize high-speed thresholds, such as anaerobic threshold, have been reported, however, this can be difficult to implement in team environments with large squads [12]. Thus, another marker, namely percentage of peak speed (PS) has been utilized to underpin high-intensity running distance (HIRD) in team athletes [13]. However, Hunter, et al. [5] found that utilizing a single physical marker to determine multiple speed zones can lead to erroneous interpretations of players activities. Additionally, it has been suggested that a measure that describes the functional limits of endurance and an additional value that characterizes sprint capacity may be ideal [14].
Maximal Aerobic Speed (MAS) has been defined as a practical and time efficient method to assess the aerobic energy system in team sport athletes [12]. Time spent above MAS has been shown to correlate with improvements in aerobic fitness [14]. Recently several authors applied this to youth athletes, using field tests to assess MAS and PS [5, 10, 15]. This approach also allows for the estimation of an individual’s Anaerobic Speed Reserve (ASR) and transition to sprint distances [5]. Therefore, an individualized approach to external load monitoring may also augment practitioners understanding of competition demands [5, 16]. The application of generic thresholds may also lead to an inaccurate external load quantification by sports science practitioners [17], whereas individualized thresholds have been proposed as a method to overcome this weakness [18]. Despite this rationale, individualized speed thresholds are not widely accepted in high-level soccer [19].
To date, no study has examined the differences in HIRD covered above generic and relative speed thresholds in English Premier League (EPL) matches. Examining league data is potentially key to improving the understanding of various methods of physical development [20]. These physical demands can also differ significantly depending on playing position and possession [21–25]. While in possession, players perform multiple high-speed and sprint activities in an attempt to create chances and score goals [26, 27]. Similarly, when not in possession, players still produce high-speed and sprint actions in an attempt to recover possession [26]. Indeed elite UEFA Champions League players produce greater efforts while not in possession across all positions [28]. It is therefore important to fully understand the differences in HIRD covered above generic and relative speed thresholds in and out of possession during match-play, to provide practitioners with detailed information on player exertion in order to design and deliver individually tailored sessions and weekly loads based on scientific principles. Further research is therefore warranted on the positional demands and effects of team possession on distance > MAS, ASR and distances > 85% PS.
Thus, the primary aim of this study was to examine the relationships between different generic and relative speed thresholds in EPL matches across two competitive seasons (2019–20 and 2020–2021). The secondary aim was to investigate the effect of playing position and team possession. The study hypothesis was that playing position and team possession will influence the quantity of distances covered above generic and relative speed thresholds in EPL match-play.
MATERIALS AND METHODS
Participants
Sixteen male professional outfield soccer players (mean ± standard deviation (SD), at the start of 2019–2020 season, age 27.8 ± 3.5 years, height 183.7 ± 5.4 cm, body mass 83.9 ± 7.1 kg) from an EPL team participated in the present study. The methodology to differentiate specialized positions was adapted from previous research [29] as various situational factors have an influence on the style of play that can be modulated by different tactical roles [30]. The small sample size is supported by previous studies in elite soccer cohorts [31–33], and consisted of three main positions, namely, defenders n = 7, midfielders n = 6, and forwards n = 3. Goal-keepers data were excluded due to their position-specific demands [34, 35]. Players’ positional data were collected from 38 matches across two consecutive seasons (2019–2020 and 2020–2021). All data evolved as a result of employment where players were routinely monitored over the course of the competitive season [36]. Nevertheless, club approval for the study was obtained [37] and ethics was provided by the local Ethics Committee of University of Central Lancashire (BAHSS 646 dated 17/04/2019) and in accordance with the Helsinki Declaration. Moreover, all players provided written consent to participate in the study. To ensure confidentiality, all data were anonymized before analysis.
Procedure
In each season, only data from 19 home league matches and 19 away league matches from the EPL were included in the analysis. Participant data were only included in the analyses when time spent on the field exceeded 75-minutes of the match [38]. For each season, players were considered when an inclusion criterion of 75-minutes playing time, in eight (10.5%) or more league matches across the two-season examined period was fulfilled. Only players with match data from both examined seasons were included in the sample. The participants performed in a median of 60% (range = 20 to 97%) of league matches across both seasons. A total of 630 individual match data points were examined across both seasons, with a median of 40.5 matches per player (range = 8 to 74). No data from international camps (training or matches) was included.
Data collection
League match data across both study seasons was recorded and analyzed via an Optical Tracking System (Second Spectrum®, Los Angeles, USA). Second spectrum optical tracking has recently been detailed by the FIFA program to meet industry standards [39]. Data was collected via semi-automated HD cameras that were positioned around the stadium at a sampling frequency of 25-Hz. The Second Spectrum match data was processed directly using the python programming language (Python 2.7) through the Spyder scientific development environment (https://www.spyder-ide.org/).
The metrics used for analysis across each season were: total distance covered; high-speed running distance (HSRD) (> 5.5 m/s); high-intensity running distance (HIRD) (5.5–7 m/s); sprint distance (> 7 m/s) [19]; total distance covered > MAS (MAS) [5, 14]; distance covered > 85% PS (PS) [40]; and distance > 30% ASR (ASR) [8]. All distances were examined as whole match totals and as distances covered in the periods of team in possession (TIP), opponent team in possession (OTIP), and ball out of play (BOP). All examined metrics were expressed both in meters and m/min (whole match, TIP, OTIP and BOP distances were respectively divided by the total, TIP, OTIP and BOP times). Before calculating these values, when individual match playing time was less than 90-minutes, distances were extrapolated to 90-minutes utilizing the meters per minute calculation. All variables obtained were calculated or pre-determined in the Second Spectrum System Software. These variables have been previously utilized by soccer practitioners to longitudinally track the external load undertaken by players [19]. The installation process, reliability and validity of Second Spectrum have been reported recently by FIFA Electronic Performance Tracking Systems (EPTS) programme [39].
Maximal aerobic speed test (MAS)
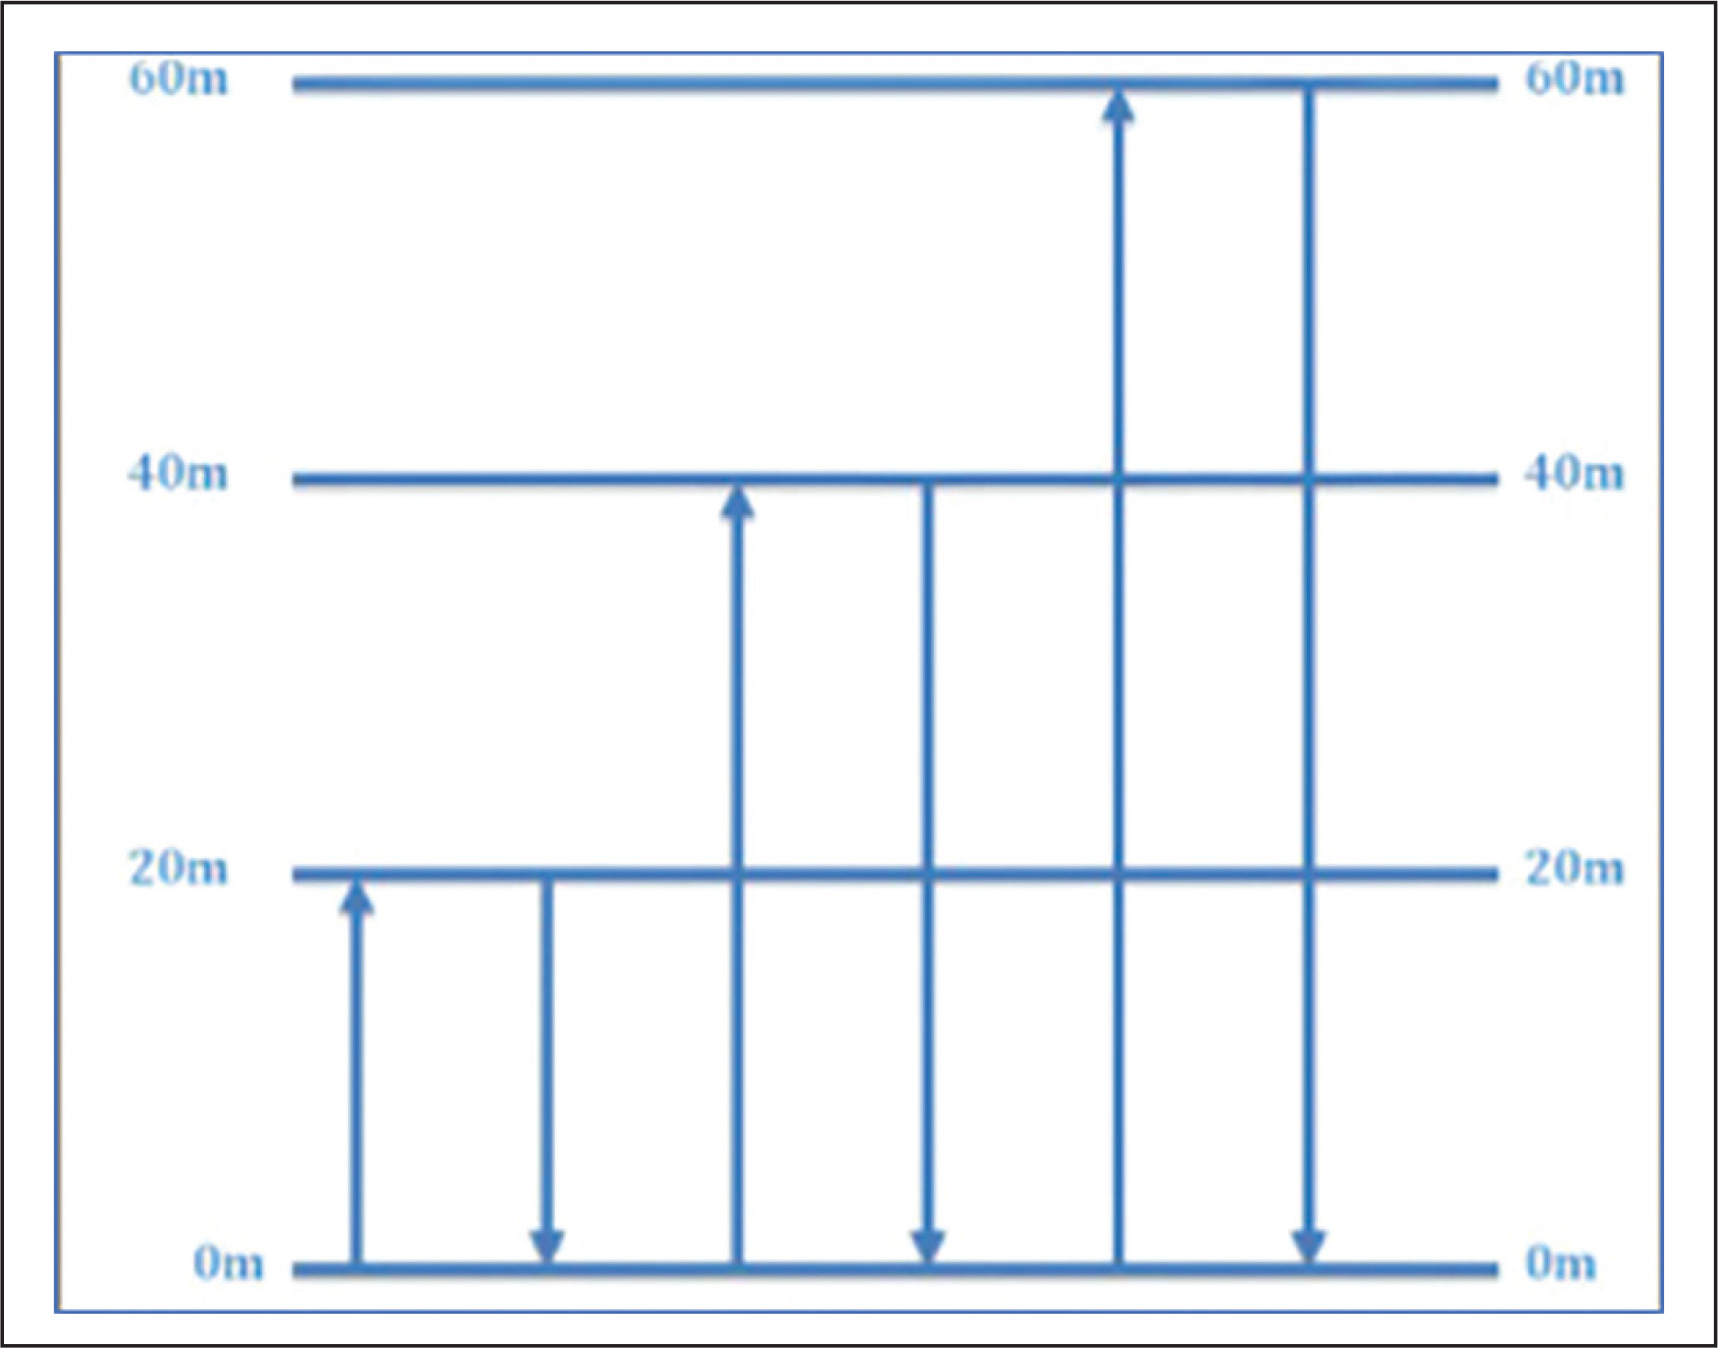
During the pre-season period, participants completed a MAS test to estimate velocity at the maximum oxygen consumption (vVO2max). The MAS protocol was a 1200 m maximum effort shuttle test. The 1200 m shuttle test has previously shown a strong correlation with other MAS tests [12, 41]. Poles were set at the start point, and 20 m, 40 m and 60 m from the starting point (see Figure 1). Players were instructed to run from the start point to 20 m and return to the start point. Players then ran to the 40 m mark and returned to the start point before running to the 60 m mark and returning to the start point. This sequence was repeated as quickly as possible five times until the distance of 1200 m had been achieved [41]. Players were informed of how much time was remaining at 1-minute intervals until the test was complete to ensure players were performing maximally [42]. This verbal encouragement has been shown to be a motivational requirement for laboratory assessments of time to exhaustion and central fatigue [43]. Due to the change of direction within the test, a corrective equation was employed, 1200/(Time – 20.3 s (0.7 s for each turn) = MAS (m/s) [12].
Maximal peak speed (PS)
Each player’s maximum PS during the season was collated using Optical Tracking System (Second Spectrum®, Los Angeles, USA). The researchers decided to use the individual maximum PS from match-play only, as an average PS per session may be influenced by positional demands and therefore would not be a true reflection of the players PS capacity. If a player produced a new PS during the season this was adjusted within the python programming language (Python 2.7), using the Spyder scientific development environment (https://www.spyder-ide.org/).
Anaerobic speed reserve (ASR)
Using MAS and PS scores, each athlete’s theoretical ASR was calculated. ASR was defined as the difference between the MAS and PS score and reported in m ∙ s−1. The MAS and PS protocols were previously utilised by Kavanagh et al. [36] to determine a soccer player’s MAS and MSS. The 30% ASR measure employed a weighted MAS value and the MSS for each player using 70% and 30% respectively as previous reported [36].
Statistical analysis
The analyses were carried using the software R, version 4.2.0 (R Foundation for Statistical Computing, Vienna, Austria), with packages lme4 and rmcorr. All variables are shown as the mean ± SD. Repeated-measure correlations were calculated to examine the relationships between the examined physical performance variables, including distances covered between or above the selected generic and individualized speed thresholds. This technique allows the calculation of paired correlations using data obtained from repeated measures on multiple individuals as in the present data set, without violating the assumption of data independence. The repeated-measure correlation (rmcorr) represents the strength of the linear association between two variables, assessed as the common individual association [44]. The magnitude of rmcorr was interpreted as Pearson’s r correlation coefficient as trivial (< 0.1), small (0.1–0.3), moderate (0.3–0.5), large (0.5–0.7), very large (0.7–0.9), and almost perfect (> 0.9) [45].
Linear mixed models with random intercept for individual players were used to compare the examined physical performance variables, standardized by time on pitch, across playing positions (defender, midfielder, forward), separately for each playing period (whole match, TIP, OTIP, BOP). When there was a significant (p < 0.05) effect for playing position, Tukey’s tests were used to examine which positions differed. The differences were standardized by the betweensubject standard deviation to determine the effect size (ES), and were evaluated as < 0.2, trivial; 0.2–0.6, small; 0.6–1.2, moderate; 1.2–2.0, large; 2.0–4.0, very large; > 4.0 extremely large [45].
RESULTS
The analysis of the results in Table 1 allowed us to conclude that for all the variables there were no grounds to reject the null hypothesis of normality of the variables analyzed, so in subsequent analyses the statistics were based on parametric tools, namely analysis of variance with repeated measures and Tuckey’s post hoc multiple comparison tests. Analysis of the results for the 5 m [s] distance (Fig. 1) revealed significant differences for the main effects: differences between groups (F = 6.61; p = 0.015; ɳ2 = 0.18); differences for the main effects before and after (F = 93.89; p < 0.0001; ɳ2 = 0.75); and for the interaction group × measurement time (F = 15.85; p = 0.0004; ɳ2 = 0.35). To determine between which groups there were significant differences for the interactions, Tuckey’s post hoc multiple comparison tests were used. No significant differences were found between the results of the 5 m [s] test in the groups analyzed before the experiment after the experiment (p = 0.0023; d = 1.57). After the experiment, the time needed to run the distance was statistically significantly shorter in the experimental group than in the control (Fig. 1).
TABLE 1
Mean ± SD values for MAS, PS, and ASR
Table 1 shows the mean MAS, PS, and ASR in the present sample of players.
The average whole match playing time for the individual match data points was 95.5 ± 4.1-minutes, whereas TIP, OTIP and BOP times were 21.9 ± 3.6-minutes (22.9%), 30.6 ± 5.7-minutes (32%), and 43.1 ± 5.9-minutes (45.1%) respectively.
For descriptive purposes, the mean ± SD values of all examined physical performance variables are reported in Table 2.
TABLE 2
Mean ± SD values for the examined distance metrics
The matrix of repeated-measure correlations with 95% confidence intervals for the examined variables is shown in Table 3.
TABLE 3
Repeated-measure correlations (with 95% CIs) between the examined distance metrics.
| Total distance | High-speed running distance (m) | High-intensity running distance (m) | Sprint distance (m) | Distance > MAS (m) | Distance > 30% ASR (m) | |
|---|---|---|---|---|---|---|
| High-speed running distance | ALL: 0.41* (0.34–0.48) | |||||
| TIP: 0.49* (0.43–0.55) | ||||||
| OTIP: 0.47* (0.41–0.53) | ||||||
| BOP: 0.40* (0.34–0.47) | ||||||
| High-intensity running distance | ALL: 0.45* (0.39–0.51) | ALL: 0.93* (0.92–0.94) | ||||
| TIP: 0.55* (0.49–0.60) | TIP: 0.94* (0.93–0.95) | |||||
| OTIP: 0.51* (0.45–0.57) | OTIP: 0.95* (0.94–0.96) | |||||
| BOP: 0.41* (0.34–0.47) | BOP: 0.95* (0.94–0.96) | |||||
| Sprint distance | ALL: 0.16* (0.08–0.24) | ALL: 0.72* (0.68–0.75) | ALL: 0.42* (0.36–0.49) | |||
| TIP: 0.23* (0.15–0.30) | TIP: 0.77* (0.73–0.80) | TIP: 0.49* (0.43–0.55) | ||||
| OTIP: 0.17* (0.09–0.24) | OTIP: 0.68* (0.64–0.72) | OTIP: 0.41* (0.35–0.48) | ||||
| BOP: 0.24* (0.16–0.31) | BOP: 0.72* (0.67–0.75) | BOP: 0.46* (0.39–0.52) | ||||
| Distance > MAS | ALL: 0.58* (0.52–0.63) | ALL: 0.91* (0.90–0.92) | ALL: 0.91* (0.90–0.92) | ALL: 0.54* (0.48–0.59) | ||
| TIP: 0.57* (0.52–0.63) | TIP: 0.86* (0.84–0.88) | TIP: 0.86* (0.83–0.88) | TIP: 0.58* (0.52–0.63) | |||
| OTIP: 0.61* (0.56–0.66) | OTIP: 0.88* (0.86–0.90) | OTIP: 0.88* (0.86–0.90) | OTIP: 0.50* (0.43–0.55) | |||
| BOP: 0.50* (0.44–0.56) | BOP: 0.90* (0.89–0.91) | BOP: 0.88* (0.86–0.89) | BOP: 0.58* (0.52–0.63) | |||
| Distance > 30% ASR | ALL: 0.36* (0.29–0.43) | ALL: 0.98* (0.98–0.98) | ALL: 0.89* (0.87–0.90) | ALL: 0.76* (0.73–0.80) | ALL: 0.86* (0.84–0.88) | |
| TIP: 0.35* (0.28–0.42) | TIP: 0.93* (0.92–0.94) | TIP: 0.82* (0.80–0.85) | TIP: 0.80* (0.77–0.83) | TIP: 0.86* (0.83–0.88) | ||
| OTIP: 0.41* (0.34–0.47) | OTIP: 0.96* (0.95–0.96) | OTIP: 0.88* (0.86–0.90) | OTIP: 0.71* (0.67–0.75) | OTIP: 0.88* (0.86–0.89) | ||
| BOP: 0.39* (0.32–0.45) | BOP: 0.98* (0.97–0.98) | BOP: 0.90* (0.88–0.91) | BOP: 0.76* (0.72–0.79) | BOP: 0.86* (0.83–0.88) | ||
| Distance > 85% PS | ALL: 0.03 (-0.05–0.10) | ALL: 0.42* (0.36–0.49) | ALL: 0.19* (0.11–0.26) | ALL: 0.70* (0.67–0.74) | ALL: 0.30* (0.23–0.37) | ALL: 0.46* (0.40–0.52) |
| TIP: 0.10* (0.02–0.18) | TIP: 0.47* (0.41–0.53) | TIP: 0.26* (0.19–0.33) | TIP: 0.68* (0.64–0.72) | TIP: 0.39* (0.32–0.45) | TIP: 0.54* (0.48–0.60) | |
| OTIP: 0.08 (-0.00–0.16) | OTIP: 0.38* (0.31–0.44) | OTIP: 0.18* (0.10–0.25) | OTIP: 0.68* (0.63–0.72) | OTIP: 0.29* (0.21–0.36) | OTIP: 0.42* (0.36–0.49) | |
| BOP: 0.16* (0.08–0.23) | BOP: 0.46* (0.39–0.52) | BOP: 0.27* (0.19–0.34) | BOP: 0.70* (0.66–0.74) | BOP: 0.35* (0.28–0.42) | BOP: 0.49* (0.43–0.55) | |
All correlations were significant (p < 0.05) with exception of correlations between total distance and distance > 85% PS for the whole match and the non-possession period. For any given pair of variables, there were no relevant differences between correlations as calculated when considering the whole match or the periods of possession, non-possession or ball out of play. There were almost perfect correlations between HSRD and both HIRD (rmcorr = 0.93, p < 0.001) and distance > 30% ASR (rmcorr = 0.98, p < 0.001). Also, HSRD showed very large correlations with sprint distance (rmcorr = 0.72, p < 0.01) and distance > MAS (rmcorr = 0.91, p < 0.001). Very large correlations were observed between HIRD and distance > MAS (rmcorr = 0.91, p < 0.001) and distance > 30% ASR (rmcorr = 0.89, p < 0.001), as well as between distance > 30% ASR and sprint distance (rmcorr = 0.76, p < 0.001) and distance > MAS (rmcorr = 0.86, p < 0.001). Very large correlations were also evident between distance > 85% PS and sprint distance (rmcorr = 0.70, p < 0.001). All other correlations ranged from small to large.
Table 4 shows the mean ± SD values for all examined distances, divided by time on pitch, across playing positions in all the considered match periods.
TABLE 4
Mean ± SD values for the examined distance metrics standardized by time on pitch.
| Positions | Whole match | TIP | OTIP | BOP | |
|---|---|---|---|---|---|
| Total distance (m/min) | Defenders | 103.2 ± 5.7 | 124.8 ± 10.7 | 145.5 ± 8.3 | 62.8 ± 4.8 |
| Midfielders | 120.3* ± 6.9 | 158.5* ± 9.9 | 165.8* ± 12.0 | 68.4* ± 4.6 | |
| Forwards | 111.7°# ± 7.1 | 160.7# ± 8.8 | 140.6° ± 10.5 | 65.9 ± 5.9 | |
| Overall | 111.0 ± 10.1 | 142.9 ± 19.9 | 152.7 ± 14.7 | 65.4 ± 5.5 | |
| High-speed running distance (> 5.5 m/s) (m/min) | Defenders | 7.2 ± 2.9 | 8.2 ± 6.9 | 15.8 ± 5.4 | 0.8 ± 0.7 |
| Midfielders | 10.3* ± 2.1 | 15.1 ± 6.5 | 20.7* ± 5.3 | 0.8 ± 0.7 | |
| Forwards | 9.9 ± 2.0 | 24.7°# ± 7.1 | 12.2° ± 4.3 | 1.0 ± 0.7 | |
| Overall | 8.8 ± 2.9 | 13.2 ± 8.8 | 17.2 ± 6.0 | 0.8 ± 0.7 | |
| High-intensity running distance (5.5–7 m/s) (m/min) | Defenders | 5.7 ± 2.0 | 6.1 ± 4.5 | 12.5 ± 4.2 | 0.7 ± 0.6 |
| Midfielders | 8.7* ± 1.7 | 12.5* ± 4.8 | 17.3* ± 4.3 | 0.7 ± 0.6 | |
| Forwards | 7.8# ± 1.5 | 18.6°# ± 4.7 | 10.2° ± 3.6 | 0.8 ± 0.5 | |
| Overall | 7.1 ± 2.3 | 10.3 ± 6.4 | 14.1 ± 5.0 | 0.7 ± 0.6 | |
| Sprint (> 7 m/s) distance (m/min) | Defenders | 1.6 ± 1.0 | 2.1 ± 2.8 | 3.2 ± 1.8 | 0.1 ± 0.3 |
| Midfielders | 1.7 ± 0.8 | 2.5 ± 2.4 | 3.4 ± 1.8 | 0.1 ± 0.2 | |
| Forwards | 2.1 ± 0.9 | 6.1°# ± 3.2 | 2.0 ± 1.4 | 0.2 ± 0.3 | |
| Overall | 1.7 ± 0.9 | 2.9 ± 3.0 | 3.1 ± 1.8 | 0.1 ± 0.3 | |
| Distance < MAS (m/min) | Defenders | 14.6 ± 4.3 | 19.2 ± 10.7 | 29.5 ± 8.9 | 2.2 ± 1.2 |
| Midfielders | 19.4* ± 3.1 | 31.3* ± 8.7 | 36.2* ± 8.2 | 1.8 ± 1.1 | |
| Forwards | 20.9# ± 2.8 | 50.6°# ± 10.9 | 26.1° ± 6.3 | 2.5° ± 1.2 | |
| Overall | 17.4 ± 4.5 | 28.3 ± 14.6 | 31.6 ± 9.2 | 2.1 ± 1.2 | |
| Distance < 30% ASR (m/min) | Defenders | 6.1 ± 2.3 | 7.6 ± 6.0 | 12.9 ± 4.9 | 0.7 ± 0.6 |
| Midfielders | 7.8* ± 1.8 | 11.5 ± 5.3 | 15.0 ± 4.8 | 0.5 ± 0.6 | |
| Forwards | 7.9 ± 1.6 | 20.9°# ± 6.6 | 9.0°# ± 3.3 | 0.8° ± 0.6 | |
| Overall | 6.9 ± 2.1 | 11.0 ± 7.3 | 13.2 ± 5.0 | 0.6 ± 0.6 | |
| Distance < 85% PS (m/min) | Defenders | 0.2 ± 0.2 | 0.3 ± 0.6 | 0.5 ± 0.7 | 0.0 ± 0.1 |
| Midfielders | 0.3 ± 0.3 | 0.5 ± 0.8 | 0.7 ± 0.7 | 0.0 ± 0.1 | |
| Forwards | 0.2° ± 0.2 | 0.7 ± 0.8 | 0.1°# ± 0.2 | 0.0 ± 0.1 | |
| Overall | 0.3 ± 0.3 | 0.4 ± 0.7 | 0.5 ± 0.7 | 0.0 ± 0.1 | |
When examining the whole match, midfielders covered greater total distance (p = 0.037, ES = 0.89, moderate) and distance > 85% PS (p = 0.047, ES = 1.74, large) than forwards. Compared to defenders, midfielders covered greater total distance (p < 0.001, ES = 1.91, large), HSRD (p = 0.009, ES = 1.33, large), HIRD (p < 0.001, ES = 1.59, large), distance > MAS (p = 0.002, ES = 1.36, large), and distance > 30% ASR (p = 0.035, ES = 1.19, moderate). Furthermore, forwards covered greater total distance (p = 0.012, ES = 1.01, moderate), HIRD (p = 0.032, ES = 1.23, large), and distance > MAS (p = 0.003, ES = 1.65, large) than defenders.
When the team was in possession of the ball, forwards, compared to both defenders and midfielders, covered greater HSRD (p < 0.001, ES = 2.13, very large, vs. defenders; and p = 0.016, ES = 1.28, large vs. midfielders), HIRD (p < 0.001, ES = 2.17, very large, vs. defenders; and p = 0.030, ES = 1.07, moderate vs. midfielders), sprint distance (p = 0.030, ES = 1.80, large, vs. defenders; and p = 0.012, 1.37, large vs. midfielders), distance > MAS (p < 0.001, ES = 2.26, very large vs. defenders and p = 0.002, ES = 1.36, large vs. midfielders), and distance > 30% ASR (p < 0.001, ES = 2.14, very large, vs. defenders; and p = 0.005, ES = 1.47 large, vs. midfielders). Also, forwards covered greater total distance than defenders (p < 0.001, ES = 1.90, large) and midfielders covered greater total distance (p < 0.001, ES = 1.74, large), HIRD (p = 0.003, ES = 1.10, moderate), and distance > MAS (p = 0.012, ES = 0.90, moderate), than defenders.
When the team was not in possession of the ball, midfielders, compared to defenders, covered greater distance (p < 0.001, ES = 1.53, large), HSRD (p = 0.006, ES = 1.20, large), HIRD (p = 0.001, ES = 1.32, large), and distance > MAS (p = 0.006, ES = 1.27, large). Compared to forwards, midfielders covered greater total distance (p < 0.001, ES = 1.96, large), HSRD (p < 0.001, ES = 2.09, very large), HIRD (p = 0.001, ES = 2.03, very large), distance > MAS (p = 0.006, ES = 1.93, large), distance > 30% ASR (p < 0.001, ES = 2.14, very large) and distance > 85% PS (p = 0.004, ES = 2.43, very large). Furthermore, defenders covered greater distance > 30% ASR (p = 0.041, ES = 1.25, large), and greater distance > 85% PS (p = 0.047, ES = 1.44, large) than forwards.
During the ball-out-of-play phases, midfielders covered greater total distance compared to defenders (p < 0.001, ES = 1.61, large), and greater distance > MAS (p = 0.005, ES = 2.04, very large) and distance > 30% ASR (p = 0.022, ES = 2.18, very large) compared to forwards. No significant differences were observed between positions for the other variables (all p > 0.05, Table 4).
DISCUSSION
The study aimed to examine the relationships between different generic and relative speed thresholds in EPL matches across two competitive seasons, and to compare the effect of playing position and possession phase. Taken together, the present findings show low to almost perfect correlations between the examined absolute and relative distances. Distance > 30% ASR was almost perfectly correlated with HSRD, while distances > MAS were highly correlated with both HSRD and HIRD, and distance > 85% PS was highly correlated with sprint distance. During the entire match and when the team was not in possession of the ball, overall, midfielders covered greater distances than forwards and strikers, while forwards covered greater distances than the other two positions when in the ball possession phase. The average values for the generic-threshold distances measured in this study have similar magnitude to those previously reported in studies that assessed physical performance during EPL match-play [46–48].
The analysis of correlations between the examined variables revealed a close-to-perfect correlation between the distance covered > 30% ASR and HSRD. This is unsurprising, as individual 30% MAS in the present sample of players was on average equal to 5.76 ± 0.1 m/s (range 5.43–6.00 m/s), and thus very close to the generic 5.5 m/s threshold for high-speed running and, more importantly, with a low between-player variability (CV = 2.6%). It is worth noting that MAS (4.63 ± 0.19 m/s) and > 85% PS (8.10 ± 0.33 m/s) significant difference for forwards vs. defenders showed slightly higher between-player variability than > 30% ASR (both CV = 4.1%). A possible explanation for this may be the distances based on relative thresholds reporting not perfect correlations, yet still very large to almost perfect, correlations with the respective distances calculated using generic thresholds (rmcorr = 0.91 for distance > MAS vs. HSRD; and rmcorr = 0.70 for distance > 85% PS vs. sprint distance). In the process of load monitoring during training and competition in team sports, it is normally desirable for practitioners to monitor a smaller set of load metrics after reducing the number of available data and select only a few among several correlated variables [49, 50]. From a practical perspective, the present results would seem to suggest that distance covered at > 30% ASR would be unnecessary to assess in elite soccer players during matchplay as long as HSRD is examined, whereas it may still be useful and informative to assess the distance covered > MAS and especially > 85% PS, as these distances, based on relative thresholds, are not perfectly correlated with any generic distance metric. Indeed distance covered > 85% PS may be necessary for practitioners to prepare players for match-play and avoid de-training for non-starters [16]. However, it cannot be excluded that in soccer players of different levels or age categories, or in elite players playing in different elite national leagues, the individual values of > 30% ASR are more variable than in the present metrics, leading to lower relationships with HIRD. In such case, considering distance at speed > 30% ASR may be required to gain detailed information on the actual physical effort of each individual player during match-play.
A further purpose of this study was to compare the physical load across playing positions and possession phases of match-play, such as, TIP, OTIP, and BOP. Indeed, while differences between playing positions for generic distances covered during the entire match have been widely documented in male soccer players at all ages and playing levels [24, 51], only limited knowledge is available regarding positional differences of distances based on MAS, PS, and ASR, or during specific phases related to the ball in/out of play and ball possession. For example, Di Salvo, et al. [46] showed that, in a sample of EPL players competing in the 2003–2004 to 2005–2006 seasons, mean total (whole-match) HSRD (> 5.5 m/s) ranged from 681 m (central defenders) to 1049 m (wide midfielders). Although, the positionspecific HSRD covered ranged from 179 m (central defenders) to 566 m (forwards) when in the ball possession phase, and from 331 m (forwards) to 498 m (wide defenders) in the out-of-possession phase. These ranges reflect the HIRD shown by our sample of players. Furthermore, in the TIP phase, attackers covered the greatest distances among all playing positions, followed by wide midfielders, central midfielders, wide defenders and central defenders. Conversely, in the OTIP phase, the authors showed that almost similar HIRD in all defenders and midfielders, while attackers had a much lower distance covered when compared to other positions. Although the current study classified players into three position categories (defenders, midfielders, forwards) due to examining only one team and thus not having a large enough sample to consider a greater number of categories, our overall results confirm those of Di Salvo, et al. [46] concerning HSRD and extend to other relevant generic and relative distance variables in EPL players.
Indeed, the present study also reported that in the TIP phase, forwards covered greater distances than both defenders and midfielders for most of the examined high-intensity variables, including sprint distance and distance > 85% PS. Whereas for other variables forwards cover lower distances than both midfielders and forwards in the OTIP phase. These findings are likely related to the specific tactical behavior and assigned tasks of players in the TIP and OTIP phases and thus might be slightly different according to a team’s playing formation, to the specific characteristics of individual players (that is, irrespective of their position), and to the specific team defensive and offensive strategies. Instead, our results are only partially consistent with the study of Mendez-Villanueva, et al. [10] where the authors assessed, among other variables, distances > MAS and > 30% ASR during international youth (U13–U19) matches. These authors showed that, especially in the first half of the match, wide midfielders covered greater distances > MAS than full-backs, central backs and central midfielders. Furthermore, central midfielders covered lower distances > 30% ASR than all other positions, and forwards covered a greater distance at such intensity compared to all other positions. The differences between those results and the present findings may be related to the diverse positional definitions utilized and the varying match-play characteristics between youth and elite senior soccer.
Interestingly, in the TIP phase, a significantly greater sprint distance, with large effects in forwards vs. both defenders and midfielders was observed, although these differences were no more evident when considering the distance > 85% PS (Table 3). Similarly, during the OTIP phase, forwards covered significantly less distance > 85% PS than defenders and midfielders, while differences were not significant when considering sprint distance. These discrepancies may be due to the varying individual PS from different playing positions in the present sample, and the > 85% PS (defenders: 8.19 ± 0.30 m/s; midfielders: 7.96 ± 0.36 m/s; forwards: 8.36 ± 0.27 m/s). Thus, considering a relative rather than a generic speed threshold for sprint speed may provide different, and arguably more accurate, information on the actual external load of players due to inter-player and inter-position PS variability.
The distances covered in the BOP phase showed little differences between positions (Table 3). From a practical perspective, distances covered during the BOP phase may not elicit as much information regarding the players’ load and physical performance as TIP and OTIP distances, although still represent a non-negligible quantity of total distance at different intensities and may be interesting from a certain perspective. In agreement with the findings of Mernagh, et al. [52], the current study showed that forwards covered greater distances > MAS and > 30% ASR than midfielders, arguably linked to actions such as re-gaining defensive shape following an attacking phase, to prevent an opponent’s counter-attack concluding with a shot on goal, or, conversely, to occupy an advantageous position prior to the start of a new possession phase.
Despite the previous findings, some limitations of the study should be acknowledge: a) the study was conducted using only one team and thus a limited sample of players were examined, which consequently may restrict a generalization of the results; b) the playing position classification adopted did not allow for the differentiation within each unit; c) the speed distance chosen for this study did not account for the transition between the different speed and intensity zones, usually expressed by accelerometry based variables; d) internal load was not collected which would have strengthened the results of the present study; and e) contextual factors such match location, opponent ranking or match outcome was not considered for analysis that should be encouraged for future studies. Therefore, further research is warranted to assess the distances covered during match-play at relative speed thresholds in players of different levels and of a wider range of MAS, PS and ASR values and examine the nature and practical implications of high-intensity distances covered during ball-out-of-play phases in elite soccer matches. If possible, a greater sample size, acceleration and deceleration data as well as internal load variables should also be included in future studies.
CONCLUSIONS
In conclusion, the present study showed that, in EPL players, highintensity distances covered during match-play are partially different when calculated using relative, individualized speeds rather than absolute, generic thresholds. This is particularly evident for speed > 85% PS, that showed some relevant differences when compared to speed > 7 m/s. A significant novel finding of this study is that high-intensity distances covered above specific speeds based on individual thresholds have been assessed during official EPL matches, and, in general, in elite soccer players. This provides valuable information for practitioners and researchers on the individual demands of match-play. Although the generic and relative speed thresholds show almost perfect correlation, the differences between HSRD, HIRD and distance > MAS indicate that players may be exposed to more high-intensity distance when using relative thresholds. This knowledge of individualized match demands can aid practitioners in prescribing training loads to athletes. In addition, using thresholds underpinned by scientific rationale may help practitioners reduce injury risk [40] and improve aerobic performance [14] by simply monitoring and adapting to these demands. Future research should aim to examine high-intensity periods as this may highlight greater differences between positions.