

Purpose
Gynecological cancer is the fourth most frequently diagnosed cancer and the fourth leading cause of cancer death in women, with an estimated 604,000 new cases and 342,000 deaths worldwide in 2020 [1]. In clinical practice, radiotherapy, as the main treatment of gynecological cancer, can effectively control the primary tumor and regional lymph node metastasis through combination of external beam radiotherapy (EBRT) and intra-cavitary brachytherapy. High-dose-rate (HDR) brachytherapy is widely used in radiotherapy for a number of tumor sites because of its ability to deliver high doses of radiation directly to tumor sites, in cases where the tumor is accessible by the introduction of a brachytherapy applicator or needle. Gynecological HDR brachytherapy has a complex pathway. It requires theatre insertion of an applicator, usually under general anesthetic (GA), computer tomography (CT), and magnetic resonance imaging (MRI), with image export from picture archiving and communication system (PACS), and import into treatment planning system (TPS) as well as CT/MRI combined registration/fusion, applicator reconstruction in TPS, plan optimization, plan review, plan export to an afterloading machine, and finally treatment delivery. This process requires collaboration among all team members, including radiation oncologists, medical physicists, and radiographers, working together on multiple complex tasks. The dose delivered per fraction is high, with dose to high-risk clinical target volume (HR-CTV) [2] of up to 8.3 Gy per fraction. Owning to the multiple and complex procedures involved, any errors in treatment implementation may lead to radiation accidents and endanger health of patients and staff.
However, conventional quality management (QM) focuses on prescriptive approaches to the technical performance of brachytherapy equipment and lacks control over the steps of the whole process of gynecological HDR brachytherapy. Up till now, many accidents and mis-deliveries have been reported due to equipment and human errors. The International Commission on Radiological Protection (ICRP) reported numerous HDR brachytherapy events and provided special recommendations for controlling the occurrence of potential risks in its Publication 97 [3]. Several studies on events in radiotherapy have also found that far more quality and safety hazards are caused by errors or weaknesses in the overall treatment process than by device errors or software system failures [4-7]. Traditional QM alone, with reactive approaches to safety, is not enough to handle the variety and complexity of clinical process. Radiotherapy QM should be more inclined to establish quality specifications for treatment process [8-10]. Prospective QM programs proposed by the American Association of Physicists in Medicine, Task Group 100 (AAPM TG-100), with approaches for designing safe clinical workflows in advance, such as failure modes and effects analysis (FMEA), make an attempt of prospective and process-centered analysis on the quality and safety of radiotherapy [11]. Its goal is to find risks in a clinical process before a failure occurs, identify causes in advance, and take measures to reduce the possibility of their occurrence and/or increase the likelihood of their detectability. This kind of QM emphasizes clinical process analysis and development of clinic-specific or site-specific QCs that are more effective and efficient. It will not only preserve the safety of the patient and enhance clinical outcomes, but also provide the guidance and methodology for a clinic to distribute medical resources towards quality and safety in radiotherapy more effectively.
Failure modes and effects analysis is an important prospective analysis tool in QM; its goal is to find out all potential failure modes (FMs), and their effects in the process, classification, and determination of their risk levels according to occurrence (O), severity (S), and detectability (D), and then undertake corresponding measures to prevent them from occurring before any possible failure happen [11]. In the past few decades, with the increasing variety and complexity of equipment and related processes in medical settings, many institutions and clinics have adopted FMEA in QM to eliminate or reduce the occurrence of medical errors and adverse accidents [11].
The current report focused on the gynecological HDR brachytherapy process in our institution. We started a HDR brachytherapy service in 2011 for intra-cavitary gynecological brachytherapy, and introduced interstitial gynecological brachytherapy in 2016 with Elekta’s Flexitron remote afterloader, Venezia applicator (initially started our service with tandem and ring applicator), and OncentraBrachy v. 4.6.2 planning system. In most cases, EBRT and brachytherapy are carried out together, brachytherapy following EBRT. Patients receive 45 Gy in 25 fractions of EBRT and 28 Gy of brachytherapy in 4 fractions, according to the EMBRACE II protocol [12]. The radiation source used for HDR brachytherapy is iridium-192 (192Ir), and the usual duration of treatment is over two weeks, following a 2 insertion in 4 fractions of HDR delivery, with each fraction conformably planned.
Material and methods
A research team consisting of one radiation oncologist with one year of working experience and ten physicists, three of whom with more than ten years’ experience, six with one to five years’ experience, and one with less than one year’s experience, were involved in FMEA scoring of their respective work processes. Field surveys, questionnaires, and group discussions were used to collect the basic data for FMEA evaluation. Risk-based FMEA included four main steps: the first step was to outline the whole process of gynecological HDR brachytherapy, and generate a process map or tree to illustrate the workflow from beginning to end and the relationship between each sub-process. The second step was FMEA analysis of each step and identification of FMs. The third step was to use FTA to demonstrate the propagation path of high-risk FMs in the process and causes of FMs. Finally, the fourth step included design of corresponding quality control schemes targeted on high-risk FMs according to FTA results.
The aim of this work was to improve the treatment quality of gynecological HDR brachytherapy process, potentially reduce the time required to carry out the process, improve engagement with the team, reduce the pressure on team members, improve the confidence of team members in the whole process, and ensure the safety of our patients.
Process mapping
Process map or process tree is a visual demonstration of the whole treatment process, including flow and relationship of each sub-process. The process tree is crucial for FMEA, because it provides a direct and clear overview of all main processes and sub-processes in one graph, some of which may be ignored in clinical practice if not deliberately listed. For the process tree design, the most important thing is to define the level of detail. The tree should neither contain too extreme details, nor too rough steps. The standard of scale for the map is usefulness and feasibility [11]. Since each clinic or institution has its own way of treatment, the process tree is specific and its generation should involve the whole treatment team. The authors divided the entire gynecological HDR brachytherapy process into five sub-processes, including installation and calibration of source, insertion, imaging, treatment planning, and treatment delivery. The overall workflow of the treatment is showed in Figure 1, and the process map of the entire gynecological brachytherapy process is demonstrated Figure 2.


Failure modes and effects analysis
The authors tried to identify FMs, their causes, and impacts as many as possible to cover every step of the treatment process. The authors sent a FMEA spreadsheet (Supplementary Table S1) to all team members for advice and revision, in order to perfect it later to meet the final use in failure modes and effects analysis. The team members were also requested to score FMs based on three parameters, such as S, O, and D (Supplementary Table S2). The authors enclosed a scoring table (Table 1) for a reference. By referring to FMs scoring criteria in TG-100, a 10-point scale for scoring potential FMs was developed for the purpose of consistency in evaluation [11].
Table 1
Description of values of severity (S), occurrence (O), and detectability (D)
After the team members finished scoring, the authors collected all FMEA spreadsheets to aggregate the data (Supplementary Table S3). We divided the physicists into three groups based on work experience, and listed the average scores of risk priority number (RPN) for each group. RPN is a numerical assessment of risk assigned to a process or step in a process, taking values usually between 1 and 1,000. It is the evaluation metric of risk on the patient caused by undetected failures during the process of treatment. RPN is the product of three scores of S, O, and D: RPN = O*S*D. The higher the RPN score, the higher the risk and severity of the failure mode to the safety of the patient. FMs were ranked according to average RPN values, and those with highest RPN scores were selected for in-depth analysis and risk assessment.
When using RPN to evaluate the risk of FMs, the critical threshold value of RPN must be defined in order to identify high-risk FMs. The team agreed on a value of 100 as the threshold to distinguish high-risk failure modes from low-risk failure modes. The reason is that if a FM’s RPN is 100, at least two of the three parameters O, S, and D should be 5 or more, which means that this FM is more likely to occur or not easily detected, or has an above average severity. Even if two parameters are smaller than 5, the third one must be over 7, or equal to 9 or 10, which indicates that this FM either occurs frequently or is difficult to detect, or has a quite high severity. The project also adopted the standard of AAPM TG-100 that some FMs with above-average severity over 8 (average, S ≥ 8) are highly risky, even though their RPNs are lower than 100. The team members believed that they are potentially harmful to the patient and should be considered as high-risk FMs.
Fault tree analysis
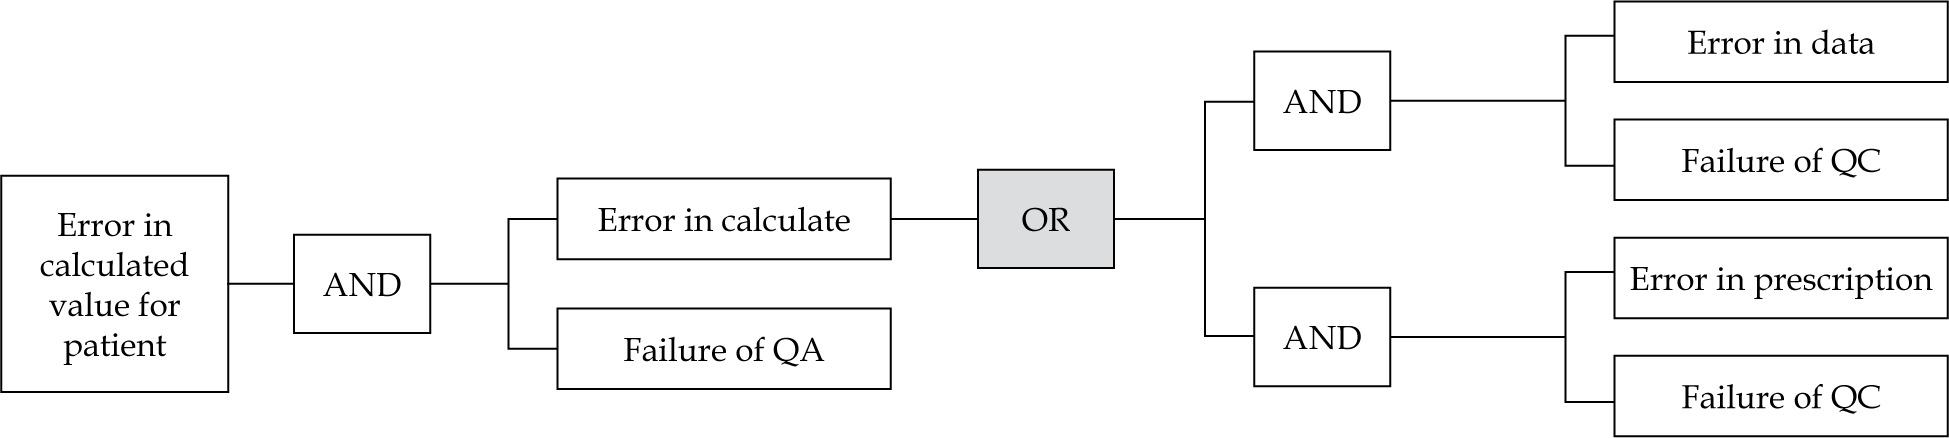
Fault tree analysis (FTA) is a deductive analysis method aimed to determine various possible combinations of causes and/or their occurrence probability. It is used to identify an unwanted event, and determine collection of various influencing factors or basic events that can lead to this occurrence [13]. Fault tree is the complement of the process tree. The flow structure of all events is presented in the shape of tree branches. A good fault tree can show a clear path of causes to failures, or what actions or events can cause an error. The branches and events are connected through logical gates. A logical OR gate or a logical AND gate join the top and bottom events. A fault tree example is demonstrated in Figure 3, where the red symbol represents OR gate and green symbol represents AND gate. We can see that whether the propagation of error can go through AND gate depends on QM measures, and if QM fails the error will cause the error in calculation. In order to prevent the error propagation, we should add QM measures into the AND gate, such as inspection, setting up regulations, necessary training, and ensuring that they will work. Therefore, the FTA analysis can be connected with FMEA to determine the causes of high-risk FMs and which sub-process is not protected by QM [6]. Through the logic gates (AND/OR) connection, we can clearly see all the causes to FMs and where are the critical points, to which we should add QM measures to stop the errors leading to unwanted top event.
Results
Process map
After collecting FMEA spreadsheets from all team members, the authors calculated that there were 30 steps under the five processes, and 57 potential FMs from the installation and calibration of source to the treatment delivery process, as shown in Table 2.
Results of failure modes and effects analysis
The authors conducted data statistics on FMEA spreadsheets of all team members, classified the causes of FMs, analyzed the distribution of RPN value, and analyzed the trend of parameters of S, O, and D with clinical impact. Seven failure modes had an RPN of over 100, and 2 of them had an RPN of over 200, making them the most dangerous failure modes. The source installation and calibration process had the lowest RPN, and the insertion process had the highest of all FMs (Table 3).
Table 3
Average of occurrence (O), detectability (D), severity (S), and risk priority number (RPN) of each process
A total of 7 of the 57 failure modes had RPNs of over 100. The treatment planning process had three modes with scores over 100, and the treatment delivery process included two highest scoring failure modes (RPN of over 200): source applicator shift during patient transfer and organ at risk change during patient setup. This is consistent with a study of Jyoti Mayadev et al. [14]. They found 5 high-risk FMs in treatment planning, and 2 high-risk failure modes in treatment delivery. Applicator shift appeared to be the most common highest ranking FMs. In contrast, there were no FMs with RPNs exceeding 100 in the process of installation and calibration of source (Table 4). Five failure modes with lower RPN ≤ 100, but S ≥ 8 were also included as high-risk FMs: wrong patient identification in insertion, dose-volume histogram (DVH) mismatch with EQD2 Gy spreadsheet, wrong patient, unreviewed plan or incorrect plan being delivered, and source stuck in treatment delivery. The results of all these failure modes can be detected easily and hence, the occurrence rate is low.
Table 4
Failure modes with risk priority numbers (RPNs) over 100 or S ≥ 8
Fault tree analysis
According to the amounts of high-risk FMs obtained by FMEA, there were 2 high-risk FMs with RPN over 200 in the treatment delivery process, one of which had the highest RPN (245.7) of all FMs. Therefore, we considered the final process - treatment delivery, as the example of FTA, and indicated how to use it to mitigate progenitor causes of errors and optimize the design of QM (Figure 4).
Fig. 4
A) Fault tree analysis for “wrong treatment delivery”. B) Part of the fault tree analysis for “wrong treatment delivery” with AND gates and inclusion of QM

From FTA in Figure 4A, it can be seen that the causes of these FMs are mostly human negligence, software and hardware errors, etc. By examining the fault tree, we could clearly find the progenitor cause to a FM and the junctions where QA activities and QC measures could be added to prevent the occurrence of potential errors. As seen in Figure 4B, the red arrow indicates that the cause could be prevented or eliminated by QA activities, such as training, communication among team members, employing checklists and forms, and establishment of procedures, regulations, or policies. The green arrow means the failures could be addressed by QC measures, such as overall commissioning of procedures and equipment, software upgrade, and preventive device maintenance.
Team member scoring analysis
Since every clinic or institution has its own situation, needs, equipment and techniques, processes, staff, or work culture, the results of FMEA methodology may differ and the number of high-risk FMs obtained from the analysis therefore vary. The differences are also caused by the scores of O, S, and D, which are subjectively influenced by differences in the number of team members, professional competence, personal judgement, and experience of medical staff involved. There is no standard clinical operation, as AAPM TG-100 recommends that each clinic should assess local processes and identify significant high-risk failure modes [11]. As the case analysis of this study focused on brachytherapy process while TG-100 has chosen a specific radiotherapy process “intensity-modulated radiation therapy (IMRT)” as a case study, whether the scoring criteria and values of O, S, and D in these two radiotherapy processes are the same, still need to be validated. Therefore, FMEA in this study were not totally referential to other clinics or institutions.
In this study, questionnaires were sent to 3 oncologists, 10 physicists, and 6 radiographers, but the responses came from 1 oncologist and 10 physicists only, without any nurses and radiographers. This resulted in a less sample, and made the whole research less quantitative and comprehensive. The numerical values of parameters were scored with limited members, while in TG-100 Report, the values are determined with experts from multiple institutions after discussion and consensus of all members.
Because of the different work experiences, the 10 medial physicists varied in their scoring. We divided the physicists into three groups based on work experience: one physicist with < 1 year of work experience, six physicists with 1-5 years of work experience, and three physicists with > 10 years of work experience. Based on Supplementary Table S3, we made a comparative bar chart of the scores of the physicists with different working experience In Figure 5, it can be seen that there is a clear difference in the scores of physicists with different working experiences. In blue boxes, the scores of physicists with > 10 years of experience differ significantly with those with 1-5 years. In yellow boxes, the scores of physicists with < 1 year work experience are very high, more than twice as high as the scores of other physicists.

We take out several FMs with obvious scoring differences for analysis. In Figure 6A, two failure modes, FM29 and FM54, were scored quite differently: physicist with > 10 years of experience scored almost three times higher than those with 1-5 years of working experience. In Figure 6B, for the four failure modes (FM11, 21, 31, and 33), the experienced physicists generally scored quite lower than young physicists with < 1 year of work experience, whose scores were fairly high. These differences in scores can be attributed to different understanding of scoring criteria, and can also be caused by personal experience and expertise. The inexperienced physicist tended to be careful and precautious because of lack of practical experience, and scored those FMs that could have not been encountered with high probability, low detectability, and high severity. Therefore, from our analysis, we can find that the FMEA methodology can be biased by these personal differences. If we want to achieve a more subjective and meaningful results, it is critical to include all members of the treatment team, and get everybody familiar and in agreement with scoring standard with proper training, group discussions and coordination, and repeated brainstorming.

Discussion
Quality management of human failures
From the data analysis, human factors were the most common FM. This is consistent with the results of other similar studies [12,14,15]. Thomadsen studied 108 failure events in brachytherapy, and found that most of them were caused by “inappropriate actions by person” [16]. Human failures may be related to time tension of brachytherapy, and lack of record and verification systems compared with external irradiation [17]. Other reasons include insufficient training, wrong judgement, lack of communication within and between departments, absence of procedure guidance, insufficient attention, time pressure, and fatigue. Swamidas et al. [17] reported in their study that “lack of communication among team members” was a crucial reason related to high-risk FMs.
With the growing complexity of gynecological HDR brachytherapy, more concrete and substantial methods are needed to reduce human errors. A paper-plan QA verification and checklist has been proven useful to restrict individual or group behavior, and improve communication among team members [9,18]. In a study conducted by Jyoti Mayadev and colleagues [14], communication error, such as “fail to inform dosimetry that the simulation was completed”, was scored as the highest ranking failure mode as applicator shift. In order to find these failure modes, they suggested the use of checklists with timestamps. Checklists can be used from the installation and calibration of source to the treatment planning process, covering categories, such as transfer of simulation, start and finish of dosimetry, insertion, and completion of the plan. Moreover, checklists can include geometry of the implant and other details of the procedure. The checklist can mitigate person-to-person deviation and reduce errors caused by lack of communication.
General and routine QA strategies can also be implemented to reduce human failures. For instance, all the members of brachytherapy team must clearly know the specific date and time of the required operation, treatment procedure, so that all steps can be closely connected.
Personnel training is also important. Due to the complexity of HDR brachytherapy, all participants must undergo strict training to be competent for relevant work. Team members must be familiar with the whole process and understand each step in addition to their own parts. Emergency plan and on-site handling are also indispensable. Abnormal exposure and leakage of radioactive sources caused by improper human operation or equipment failure will hurt patients or medical personnel. Therefore, it is particularly important to establish a set of emergency plan and countermeasures. Relevant personnel needs to be regularly organized to drill the emergency plan, and be familiar with faults and handling methods in order to make quick and accurate response in case of an adverse condition.
High-risk failure modes analysis in source installation and calibration
There were a total of 10 failure modes in the process of installation and calibration of source, mainly concerning the radioactive source and information. Some failures were caused by staff operational errors, while others were due to reading or calculation errors. The average severity score was very high, over 7.3. It means that the failures not only resulted in all patients being treated at an excessive or insufficient dose, but also resulted in staff being harmed. However, the probability of occurrence and the likelihood of non-detection scores were only 1.4 and 1.5, respectively. Hence, there were no failure modes with RPNs over 100 in this part. As they can be easily detected and avoided, quality management can include the use of radiation monitors, daily quality inspection, TPS QC, and RAKR measurement standards. After each replacement of a new radioactive source, the source strength should be calibrated, and it also needs to be checked regularly.
High-risk failure modes analysis in insertion process
The insertion process has five steps. Failures usually occur in the applicator placement step, including selection of wrong applicator, and malfunction of applicator recording and connecting. There are also risks of incorrect patient identification, and inadequate preparation of patient and applicator shift due to patient movement. These problems can lead to errors in dose distribution and deviations in dose levels. Physicist planning checks can detect most of these failure modes, and pre-treatment verifications by radiographers can also prevent some of these failures from occurring. At our institution, a special checklist is deployed in QM with details of the length and diameter of applicator to be used, and position of the needle inserted into ovoids (Figure 7). There was only one failure mode with RPN over 100 in insertion process. It was applicator shift (RPN = 135.786) in the patient transfer step. This failure mode can be detected by plan review. There was also a failure mode with a severity of 8.6, that is, wrong patient. Despite the high severity of this failure mode, the probability of occurrence and the likelihood of non-detection were both low, with scores of 1.8 and 1.7, respectively. This can be prevented by an electronic wrist tag that can be used to confirm patient identity with hospital record system.

High-risk failure modes analysis in imaging process
Failures in the imaging process are mainly due to errors in patient transfer, identification information, problems when images are taken and transferred, errors during fusion, and reconstruction of images. Failures in imaging can affect the subsequent planning process, and wrong images can lead to problems, such as incorrect applicator reconstruction. The image on the left in Figure 8A is what the correct image fusion looks like, with CT and MR images matching perfectly. The image on the right in Figure 8B is a failed image fusion, where the applicator is not on the same level. Failure of the image fusion can lead to incorrect dose distribution and inappropriate dose reporting. In this project, the image fusion errors received a very high average severity score of 7.9, but the probability of occurrence and the likelihood of non-detection were only 2.3 and 3.4, respectively. Therefore, the average RPNs did not reach 100, only 61.778. Accurate applicator reconstruction is very important in reducing uncertainties during treatment, because 1 mm applicator displacement in reconstruction may cause a 5-6% change in the average DVH parameters [19]. Therefore, in order to prevent errors and delineate correct target volume in organ at risk (OAR), applicator reconstruction should be performed on the same image study used by the doctor, and the applicators should be reconstructed manually or through library applicator [2]. Checks by the radiographer during imaging and by the physicist during planning can also be effective in avoiding these errors. Again, only the RPN of the applicator shift during patient transfer exceeded 100, with a score of 142.56. This high-risk FM will be discussed in later process of treatment delivery.

High-risk failure modes analysis in imaging treatment planning
The treatment planning process consists of steps of voluming, planning, plan review and checking, and transfer of the plan. Doctor’s contouring can cause errors in target area, margin, and organ at risk, which can lead to incorrect dose distribution, overdose, or underdose. Therefore, when the doctor completes voluming, there should be a peer review by another doctor to ensure that the information is correct. Failures in reconstruction, planning system, and transmission of data can occur in planning process that may lead to errors in dose distribution and deviations. A verification by another medical physicist will largely reduce the occurrence of these errors. However, if the check is forgotten or if there is no independent dose check, such errors will not be detected, and serious consequences might occur. Thus, absence of checking has a severity score of 7.4. There were three failure modes during the treatment planning process that scored over 100 points. One of these was an error in contouring the volume of target area and the other two were both errors regarding needle reconstruction. The reconstruction errors were mainly human factors, either because of the wrong form filling, as seen in Figure 7, or the physicist’s operational errors.
Incorrect target area volume contouring is a very serious failure mode. The average score for the probability of this FM occurring was 3.7, the average score for not being detected was 3.9, and the average score for severity once it occurs was 7.2, almost twice as high as the first two FMs. In view of technical or device QM, high quality planning on thin-slice images can guarantee the quality of contouring and avoid unnecessary errors. The Groupe Européen de Curietherapie and the European Society for Radiotherapy and Oncology (GEC-ESTRO) suggests using both low-field and high-field MRI machines for planning, which can accurately delineate target volume and organ at risk, and can improve contouring agreement among doctors and physicists. At least two MRI examinations are needed for gynecological cancer brachytherapy [20]. In view of human failures, one possible reason is that doctors are not quite familiar with the contouring system, hence, making some isolated points and outline errors. The contouring process is very complex, including image fusion, transmission, automatic contouring, target mapping, and expansion, which could be another reason. In view of unfamiliar operation of contouring software, training on manual and automatic contouring, contouring synthesis, image storage, and transmission are all needed in QM; training radiation oncologists on relative delineation protocol can help reduce contouring uncertainties and improve agreement [21]. Adding a redundancy in QA peer check and verification after contouring is completed, are also useful. The allowable margin of error for the target area is 9% [22]. Doctors and physicists can form a verification team to check the contouring, image storage, and transmission. In terms of the complex procedure, it can be considered to simplify the whole process by reducing the numbers of contouring and transmission of image information in order to reduce the error probability and increase detectability. Meanwhile, the establishment of contouring guidelines or protocol can also be helpful to decrease errors and improve consensus among the doctors and physicists [23,24].
Since the physicists have to manually select the needle and choose the tip end and connector end themselves, needle reconstruction error is mostly caused by human error. Figure 9A shows the correct reconstruction of the needle, and Figure 9B demonstrate the incorrect one, in which the fifth needle was reconstructed with the front and rear position reversed. However, such reconstruction errors will stop a normal plan design and can be easily detected during the physicist’s plan check. The permissible error is organ-dependent, 5-6% per mm for D2cc and D0.1cc in ant-post shift, and 4% per mm in other direction [19]. Incorrect equipment documentation is the result of man-made information error during filling the checklist (Figure 7), which leads to needle place error, causing wrong dose distribution. However, this failure mode can be avoided by the physicist’s planning check, double checks, or pre-treatment verification by the radiographers.

High-risk failure modes analysis in treatment delivery
In the final process of treatment delivery, failures usually arise from the patient transfer, patient preparation, and treatment. Patient movement can lead to failure modes, such as applicator shift and changes in the position of OAR. Errors, including failure to connect afterloading treatment machine to the applicator, movement of the applicator, radioactive source stuck, and wrong treatment planning, can all occur during the process of treatment. These failure modes can result in minor dose deviations for the patient or serious harm to the patient health. Machine malfunction and planning errors can be prevented and avoided with pre-treatment checks by the radiographers. However, problems, such as applicator shift, are difficult to be detected. Therefore, this process had two of the highest risk failure modes, applicator shift and change of OAR, both with RPNs over 200. Their average detectability scores were 6 and 7.8, respectively, which indicated that their risk was mostly in the difficulty of being detected. Takayuki et al. [25] analyzed the detection timing and trigger for 64 HDR treatment events from ICRP 97 [3] and NRC (Jan, 2007 to Sept, 2011) [26], and found that 9 events were due to wrong applicator position/setting, which could only be detected after the treatment. Our result also agreed with a study of Mayadev et al. [14]. They found that 4 of top 6 high-risk failure modes were caused by inability to detect movement of patient and applicator during patient transfer. Three other high-risk failure modes had average severity scores of 8 or more. The unchecked plan or incorrect plan and source stuck received high scores of 8.9 and 9.4, respectively as well as the highest score of 9.8 for the incorrect patient. As for FM of unchecked or incorrect plan, a checklist of treatment delivery can be added for QM with details, such as plan name, date, and dose, and can serve as an on-site guarantee for selecting a correct plan. The possibility of occurrence of source stuck was only 1.3, meaning this kind of event is rare. But, as this FM is deemed high-risk to the patient and medical staff, it cannot be completely avoided, and an emergency response in QM must be prepared. Beside routine inspection of afterloaders, we suggest that prompt and proper roles should be given in advance to all team members in case of unexpected event, such as who is responsible for source recovery, who is responsible for patient rescue, etc.
Applicator shift is the most common failure mode and most likely to occur in the process of insertion, imaging, and treatment delivery. As the operating theatre, CT and MR rooms as well as treatment room are not in the same place or on the same floor, and patients have to be transferred from place to place, which would inevitably result in patient movement and shifting of the applicator. Applicator shift in the insertion process can be detected by plan review. Applicator shift during imaging can be detected by the physicist’s planning check and applicator library, and in the planning process, the applicator can be reconstructed by CT and MR images, so that the physiologist can detect abnormal position of the applicator. However, it is difficult to detect the movement of applicator that occurs with patient transfer. Any change in the position of the applicator will definitely lead to error in the dose distribution and volume, and have a serious impact on the patient health. This is why the RPN for this failure mode was over 200. To prevent this failure mode, we can strengthen the QM by establishing proper procedure guidelines, such as adopting a redundancy check in the quality checklists with special focus on a fixation device prior to treatment delivery, and consider to add internal packing, such as long cylinder pack to fix the applicator in position [14]. We can also use real-time imaging to confirm the position of applicator prior to the delivery in our institution. Takayuki et al. [25] have detected 2 errors among 2,031 treatment sessions for 370 patients within a 6-year period by using a modified C-arm fluoroscopic verification method in real-time source positioning, and suggested a worldwide use.
The average scores of O, D, and S for the high-risk FM of organ at risk change were 5, 7.8, and 6.3, respectively. Unlike the other failure modes, the probability of non-detection was higher than the likelihood of severity. After CT and MR imaging, the patient will be under the condition of waiting till the start of treatment delivery, with no other confirmation of the applicator location or the location of patient organ prior to treatment. This failure mode is therefore difficult to detect and prone to occur, and when it does happen, it can have a serious impact on the dose distribution. Therefore, a slight pre-treatment OAR change after imaging can have a huge impact on the dose distribution. This is the reason why this failure mode received the highest RPN score of 245.7.
Our results are consistent with a study by Wadi-Ramahi et al. [27]. They also found OAR change as a high-risk failure mode, and the applicator was in a relatively wrong position due to internal OAR motion. They suggested to perform pre-treatment imaging verification to detect OAR change or movement using CBCT simulator or conventional CT-SIM. If any OAR shift was found, the image can be transmitted to TPS and DVH parameters of OAR can be re-evaluated.
Conclusions
Based on the AAPM TG-100 Report, the current study verified the clinical feasibility of using FMEA to prevent or eliminate the occurrence of high-risk FMs, and improve the QM of gynecological HDR brachytherapy. We proposed certain possible QA and QC measures for reference. However, the clinical impact and relevance of the study in terms of additive QM procedures to the current protocol need to be validated further. It is planned to check the efficacy of QM by performing a FMEA study on those high-risk FMs and RPNs one year or two years later, and to compare the results of the two analyses in order to optimize and improve the QM plan.