Introduction
Breast cancer is a complex disease characterised by abnormal growth of cells in breast tissue and is the most common type of cancer among women, accounting for roughly one-third of all cancer cases among women in Iraq [1]. In 2020, 2.3 million women received a breast cancer diagnosis, and there were 685,000 deaths globally [2]. Cancer is the second leading cause of death globally and claimed 9.6 million lives in 2018. Worldwide, cancer is the cause of about 1 in every 6 fatalities. More than 70% of deaths in low- and middle-income nations are caused by cancer [2]. Local investigations conducted in Iraq have demonstrated that the short survival is mostly attributable to advanced stages at the time of presentation as a result of delayed diagnosis and treatment [1, 3].
Prior research has identified a number of characteristics that can affect patients, healthcare practitioners, or the health system during diagnosis and treatment [4]. The interval between the beginning of symptoms and the first medical consultation is characterised as patient delay and corresponds to delays in seeking medical attention. On the other hand, provider delay occurs between the initial medical diagnosis and the beginning of definitive treatment. It is typically connected with the medical team and the health system, and the acceptable threshold is only one month [5]. Breast cancer diagnosis in women presents significant obstacles in terms of early identification, proper staging, and breast cancer surveillance [6]. Consequently, the development of novel biomarkers to enhance diagnosis, prognosis, and prediction is required, as are cost-efficient and precise screening techniques for this malignancy [7].
The American Cancer Society states that the aim of early breast-cancer screening is to find cancer before any symptoms manifest. Screening is a way to find illnesses such as cancer even when there are no obvious signs. The goal of early detection is to diagnose breast cancer as early as possible [6]. The oncoprotein intracellular tyrosine kinase human epidermal growth factor (HER-2/neu) is a short trans membrane segment. It is a commonly cleaved ligand-independent receptor, and subsequent signalling takes place on the surface of cells overexpressing HER-2/neu [8]. Overexpression of HER-2/neu protein or oncogene amplification would enable more focused use of trastuzumab as a single agent or in conjunction with cytotoxic chemotherapy. Additional predictive parameters for trastuzumab-based treatment response are currently lacking. As a result, researchers are attempting to uncover such factors by examining the predictive capacity of serum HER-2/neu [9].
Serum HER-2 levels can be used to determine the efficacy and prognosis of treatment in HER-2-positive breast cancer patients [10] . Trastuzumab is a chemotherapeutic infusion drug. To prevent cancer cells from growing further, the medication acts as a protein that binds to and targets the HER-2 protein. Rapid growth and spread characterise the aggressive HER-2 subtype of breast cancer. HER-2 protein is present in about 1 in 5 patients with breast cancer. The aim of the study is to evaluate the influence of trastuzumab therapy on serum levels of HER-2 protein and breast cancer cell lines by determining HER-2 protein, cytotoxicity, and inhibitory concentration (IC50) values.
Material and methods
Considerations for ethical behaviour
The study comprised the collection of blood samples as well as experimental methodologies approved by the Al-Diwaniyah Teaching Hospital and Cancer Centre’s Ethics Committee. Before the samples were collected, all the research participants gave their permission to the University of Al-Qadisiyah. Furthermore, all techniques and protocols were carried out in accordance with the guidelines and regulations of the Ethical Committee of the College of Medicine, University of Al-Qadisiyah.
The subjects
The samples were taken from persons at Al-Diwaniyah Teaching Hospital and the Al-Diwaniyah Cancer Centre between 1/2/2023 and 20/7/2023. The blood samples were 120 blood samples acquired from Iraqi subjects. The participants included (60) healthy persons as a control group (G1) and (60) cancer patients as a treatment group (G2). The kit is provided from Elabscience/USA and a cancer cell line were obtained from the IRAQ Biotech Cell Bank Unit in Basrah.
Determination of human EGFR2 (HER-2)
ELISA kit protocol (Elabscience, USA) was used to determine the quantities of Human EGFR2 in serum in vitro.
Medium preparation
Six hundred millilitres of triple distilled water (TDW) (US Biological, USA) was used to dissolve 10.4 g of RPMI-1640 medium powder (Gibco, USA). 100 ml of 10% foetal bovine serum (FBS), 2.2 g of sodium bicarbonate powder, 1 ml/l of ampicillin (100 g), and 0.5 ml/l of streptomycin (505 g) were also added. According to the manufacturer’s recommendations, the volume was increased to 1 L with TDW, and the medium was sterilised using a Nalgene filter and a 0.22 filter unit [11].
AMJ13 and MCF-7 cell lines and cultures
The AMJ13 and MCF7 human breast cancer cell lines were donated by the Cell Bank Unit in Basrah, Iraq. RPMI-1640 medium (US Biological, USA) supplemented with 10% (v/v) FBS (Capricorn-Scientific, Germany) and 1% (v/v) penicillin-streptomycin were used to culture the cells. (Capricorn-Scientific, Germany) at 37°C in a humidified environment with 5% CO2. Experiments were carried out using exponentially expanding cells [12]
Maintenance of cell cultures
Cancer cell lines were obtained from the Iraq Biotech Cell Bank Unit in Basrah and maintained in RPMI-1640 supplemented with 10% FBS, 100 units/ml of penicillin, and 100 µg/ml of streptomycin. Cells were passaged using Trypsin-EDTA, reseeded at 70% confluence 2–3 times a week, and incubated at 37°C in 5% CO2 [11].
Preparation of stock and diluted trastuzumab solutions
Sterile Eppendorf tubes (1.5 ml) were prepared and numbered, and 25 ml of 1% DMSO (dimethyl sulfoxide) were prepared. Trastuzumab stock solution (2000 µg/ml, 2 mg/ml, 2.475 mM) was prepared by dissolving 20 mg of trastuzumab in 10 ml of DMSO solution. Diluted trastuzumab solutions (125, 250, 500, 750, 1000, 1250, and 2500 µg/ml) were prepared using the trastuzumab stock solution in DMSO (1%).
Exposure of cell lines to trastuzumab
AMJ13 and MCF-7 cell lines were cultured in the same way in a 96-well microplate. After incubation, the media was aspirated the plate using a multipipette, and 100 µl of diluted trastuzumab solution was added to wells in each column in accordance with the number of Eppendorf tubes. Furthermore, 100 µl of serum free media (SFM) was added to other wells as a control. Three replicates were used for each concentration. The plate was covered with a sterile adhesive Parafilm and incubated at 37°C for 72 hours, after which the optical density (OD) was read by a 3-(4,5-dimethylthiazol-2-yl)-2,5-diphenyltetrazolium bromide (methyl thiazolyl tetrazolium – MTT) assay, and the cytotoxicity ratio was calculated [13].
Methyl thiazolyl tetrazolium cytotoxicity assays
AMJ13 and MCF-7 cells were seeded at a density of 1 × 10⁴ cells in a 96-well microplate and incubated at 37oC for 24 h until monolayer confluence was achieved [14]. Cytotoxicity was examined using an MTT cell viability assay. The cells were exposed to a range of trastuzumab concentrations (125, 250, 500, 750, 1000, 1250, and 2500 µm/ml). Methyl thiazolyl tetrazolium dye solution (2 mg/ml) was applied to each well at 72 hours after infection. After 3 more hours of incubation, the MTT solution was removed, and the crystals remaining in the wells were solubilised by the addition of 100 µl of DMSO, followed by incubation at 37°C for 15 min with shaking [15]. The optical density was measured at 492 nm using a microplate reader. The cytotoxicity (inhibition) was calculated using the following equation:
Cytotoxicity % = (ODcontrol – ODsample) /ODcontrol × 100
where ODcontrol is the mean OD of untreated wells, and ODSample is the OD of treated wells [16].
Ethical considerations
All parents or caregivers of the participating patients provided their signature on a consent form to take samples. The study adhered to the ethical guidelines outlined in the Declaration of Helsinki (1964) for medical research involving human participants. Ethical approval for the study was obtained from the Ethical and Research Committee of the Department of Medical Chemistry, College of Medicine, University of Al-Qadisiyah, and Al-Diwaniyah Teaching Hospital Iraq.
Statistical analysis
The data were analysed using Graph Pad Prism® software, which examined the features of both the patient and control groups. The Kolmogorov-Smirnov test was used to standardise the data, and non-parametric tests were employed for non-normal data. Statistical tests were used: test for lognormal distribution, independent-sample t-tests, and ROC curve. Statistical significance was indicated by a p-value less than 0.05. For normal data, independent-sample t-tests were utilised, while the Kolmogorov-Smirnov test was used to recognise normal and non-normal data. Linear regression was employed to obtain a more comprehensive knowledge of the variable’s dynamics.
Results
Assessment of serum HEGFR-2
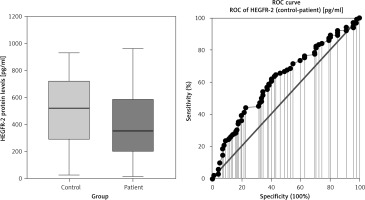
A comparison of serum HEGFR-2 (HER2) between patients with breast cancer and the control group is shown in Fig. 1, Table 1. Mean serum HER2 was significantly lower in patients with breast cancer compared to the control group, at 388 ±237 U/ml vs. 504 ±261 U/ml, respectively (p = 0.012).
Table 1
Comparison of serum HEGFR-2 between patients with breast cancer and control group
| Characteristic | Control group, n = 60 | Breast cancer, n = 60 | p-value |
|---|---|---|---|
| HEGFR2 [pg/ml] | |||
| Mean ±SD | 504 ±261 | 388 ±237 | 0.012 I* |
| Range | 24–1073 | 14–961 | |
| KS | 0.0007 | 0.0007 | |
| IQR | 442 | 395.5 | |
| Median | 522 | 353 | |
| CV (%) | 51.9 | 61.0 |
[ii] Biochemical parametric variable was obtained from serum measurements taken after a period of fasting. Independent-sample t-tests were utilised for parametric variables and normally distributed, including HER2. Unpaired t-test was used for parameter between 2 variables (control and patient). n: number of cases. The interquartile range, Kolmogorov-Smirnov test, standard deviation, coefficient of variation, and human epidermal growth factor receptor 2 are represented by IQR, KS, SD, CV (%), and HEGFR2 or HER2, respectively. Statistical significance was indicated by *p < 0.05, **p < 0.01, and ***p < 0.001.
Cytotoxicity (inhibition) of Herceptin in cell lines
Inhibition of Herceptin in MCF-7 cell line
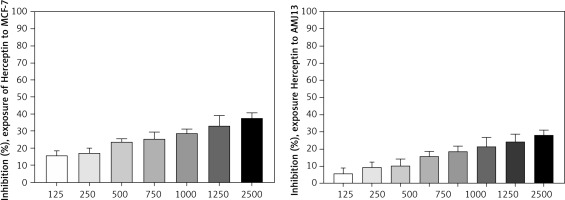
The effect of cytotoxicity (inhibition) was evaluated using different concentrations of Herceptin (125, 250, 500, 750, 1000, 1250, and 2500 µg/ml) (Fig. 2) on MCF-7 cell line by MTT cytotoxicity assay. From these results, increased concentration of the Herceptin was shown to increase cytotoxicity or enhance growth inhibition.
Inhibition of Herceptin in AMJ13 cell line
The effect of inhibition was evaluated using different concentrations of Herceptin (125, 250, 500, 750, 1000, 1250, 1500, and 2500 µg/ml) (Fig. 2) on AMJ13 cell line by MTT cytotoxicity assay. From these results, increased concentration of the Herceptin was shown to increase cytotoxicity or enhance growth inhibition.
Determination of inhibitory concentration of Herceptin
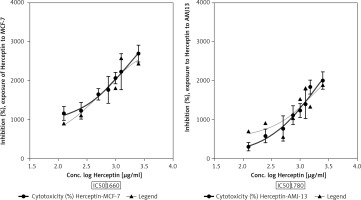
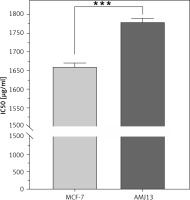
The half maximal IC50 is a measure of the potency of a drug, or inhibitor in inhibiting breast cancer cell lines. Inhibitory concentration is a quantitative measure that indicates the amount of a particular inhibitory substance (Herceptin) needed to inhibit proliferation of breast cancer. To evaluate the effect of each treatment on cell proliferation, IC50 value was measured in breast cancer cell lines. Inhibitory concentration was estimated by plotting x-y and fit the data with a straight line. Statistical data of IC50 for comparison of cell lines after treatment with Herceptin can be seen in (Fig. 3), where IC50 value for the Herceptin in MCF-7 cell line was 1660 µg/ml while for AMJ13 cell line was 1780 µg/ml. The present study showed a significant difference in IC50 between MCF-7 and AMJ13 cell lines at p-value> 0.0001 (Fig. 4).
Discussion
In the present study, when compared to the healthy controls in this investigation, the serum levels of HER-2 in breast cancer patients were considerably lower. It is thought that the enhanced synthesis of auto-antibodies is caused by the recognised mechanisms causing the lower serum HER-2 [17] . The results of the present study concur with those of earlier investigations [18]. According to one study [19] , serum HER-2 concentrations gradually decreased following the start of treatment, especially within the first week. It was observed that serum HER-2 levels were reduced significantly in 60 women who had breast cancer therapy. Several previous studies have reported decreased serum HER-2 levels in a proportion of patients with breast cancer [20].
Another study [8] found that 69 of 265 patients (26%) who were included in a phase III second-line hormone therapy trial for advanced breast cancer had significantly lower serum EGFR levels. This finding is consistent with our findings. Serum EGFR levels, clinical chemistry, laboratory medicine [1, 5–21], and healthy controls were used to identify breast cancer patients from healthy controls [21]. HER-2 was detected in extracellular vesicles of patients with breast cancer through an immunosensor based on a silica-chitosan nano-platform (Talanta).
In line with the current observations, another study [20] reported that serum HER-2 in women with breast carcinoma was significantly lower than that of the control group. Another study [22] evaluated serum HER-2 in 60 women with invasive breast carcinoma and compared them to 60 healthy control subjects. In addition, the present study results also agree with a study on 40 women with invasive breast cancer and 20 healthy controls, which found similar results of significantly decreased serum HER-2 levels in patients compared to the control group [23]. Another study [24] also found significantly reduced serum HER-2 levels in patients with invasive breast cancer compared to the control group. In this study, we evaluated the decrease of HER-2 after neoadjuvant treatment and its relationship with treatment efficacy and patient prognosis. A significant association was found between the decrease in HER-2 levels in patients with breast cancer compared to the controls, which agrees with another study [24].
The present study showed a significant difference in IC50 between MCF-7 and AMJ13 cell lines. This is due to the presence of some differences between them. The cell lines are both commonly used in breast cancer research, but they have some key differences. Regarding origin, the MCF-7 cell line was derived from a 69-year-old White woman with metastatic breast adenocarcinoma in 1970. In contrast, the AMJ13 cell line was derived from a 70-year-old Iraqi woman with breast cancer, who was the mother of 6 children. Her name was Jabria, and she was from Baghdad’s Al-Amen district, weighed 70 kg, and was 160 cm tall. This cell line is noteworthy because it is the first breast cancer cell line derived from an Iraqi woman [12].
MCF-7 cells typically do not overexpress HER-2 protein. In contrast, AMJ13 cells overexpress HER-2 protein, as shown in Figure 4. Regarding growth characteristics, MCF-7 cells are known to exhibit an adherent growth pattern, meaning they attach to the culture dish’s surface. They have a slower growth rate compared to some other breast cancer cell lines. It is important to note that cell lines can evolve and change over time due to various factors, including culture conditions and passages.
In this study, trastuzumab treatment was toxic to MCF-7 and AMJ13 cell lines in the laboratory at varying dosages. This shows that the treatment is effective. Patients showed a drop in the amount of HER-2 in the serum when compared to healthy patients, and prior research showed the efficiency of the treatment [25]. We discovered that trastuzumab had an impact on these 2 mild breast cell lines with a low HER-2 expression. After 72 hours, we discovered that trastuzumab consistently caused cytotoxicity in both cell types.
The IC50 values were decreased when lengthening exposure duration. The IC50 levels of MCF-7 and AMJ13, respectively, reached 1660 g/ml and 1780 g/ml after 72 hours. The high IC50 result agreed with the findings of [26] that trastuzumab concentrations below 25 g/ml did not cause cytotoxicity in either cell line. Furthermore, trastuzumab at low concentrations effectively inhibits over-expressed HER-2 in breast cancer cells [27]. The rate of cancer cell growth was reduced inversely to the increase in trastuzumab dosage, indicating dose-response activity.
In this study, the susceptibility of the cell line panel to the direct inhibition of HER-2 signalling with breast cancer cell lines was limited. AMJ13 and MCF-7 showed significant growth arrest in response to trastuzumab, and these results suggest that breast cancer cells that express low levels of HER-2 are capable of binding sufficient trastuzumab to induce an antibody-dependent cell-mediated cytotoxicity response. This agrees with another study [28].
Our results are also consistent with other findings [29], which showed a trastuzumab-induced antibody-dependent cell-mediated cytotoxicity response. Our results revealed that this response was strong. However, there is still a need for target ratios and further investigation of the mechanisms underlying the susceptibility of tumour cells to trastuzumab [10].
In vitro studies using breast cancer cell lines have shown that trastuzumab can inhibit the growth and proliferation of HER-2-positive breast cancer cells. This is achieved by blocking the HER-2 receptor and interfering with the signalling pathways involved in cell growth and survival. Trastuzumab can induce cell cycle arrest and apoptosis in HER-2-positive breast cancer cell lines. Trastuzumab treatment can also lead to a decrease in serum HER-2 protein levels. This reduction in serum HER-2 protein is often used as a biomarker to monitor the response to trastuzumab therapy.
Conclusions
The study provides significant evidence that trastuzumab-based therapy leads to lower serum levels of HER-2 in breast cancer patients. Additionally, the in vitro experiments on breast cancer cell lines demonstrate that increasing concentrations of trastuzumab enhance growth inhibition and cytotoxicity. These findings have important implications for breast cancer management because they suggest that monitoring serum HER-2 levels and evaluating the response of tumour cells to trastuzumab can aid in predicting the clinical course of the disease. This knowledge can assist healthcare professionals in making more informed decisions regarding treatment options and resource allocation for breast cancer patients.


