


Introduction
In clinical dermatology, the diagnostic algorithm predominantly integrates patients’ medical histories with dermatological assessments to delineate pathological entities. This diagnostic framework involves a visual inspection of cutaneous manifestations, augmented by tactile palpation, which together facilitates the elucidation of lesion morphology, distribution, configuration, and scope. Despite the predominance of two-dimensional (2D) parameters, the estimation of lesion depth often necessitates the incorporation of indirect methodologies, such as nuanced visual analysis of lesion elevation and tactile exploration, thus engendering a conceptual three-dimensional (3D) representation [1]. In scenarios where the clinical examination and auxiliary investigations do not yield a definitive diagnosis, skin biopsies become paramount for histopathological analysis. This analytical modality employs conventional staining procedures, supplemented by more intricate techniques like immunohistochemistry or direct immunofluorescence (DIF), to demystify pathophysiological underpinnings and cement a histopathological diagnosis. Notably, histological assessment encompasses quantification of structural parameters, including, but not limited to, width, magnitude, and penetration depth, the latter bearing profound prognostic nuances, exemplified by melanoma infiltration depth. The inherent accessibility of skin biopsy fosters the establishment of clinicopathological correlations, thus streamlining the diagnostic trajectory of dermatoses and steering therapeutic regimens. Nonetheless, it is imperative to cognize that skin biopsy, being invasive, poses risks, encompassing scarring, keloid genesis, haemorrhage, or microbial colonization. Contemporary challenges include an acute dearth of specialized dermatopathologists, culminating in protracted biopsy result durations. High-frequency ultrasonography (HFUS), a non-invasive imaging paradigm, proffers a 3D evaluative landscape, inherently encompassing the quantification of lesion depth (Figures 1, 2). Presently, this modality is witnessing amplified adoption, particularly for gauging cutaneous aging and the potency of dermatological interventions in the aesthetic domain [1–4].
Figure 1
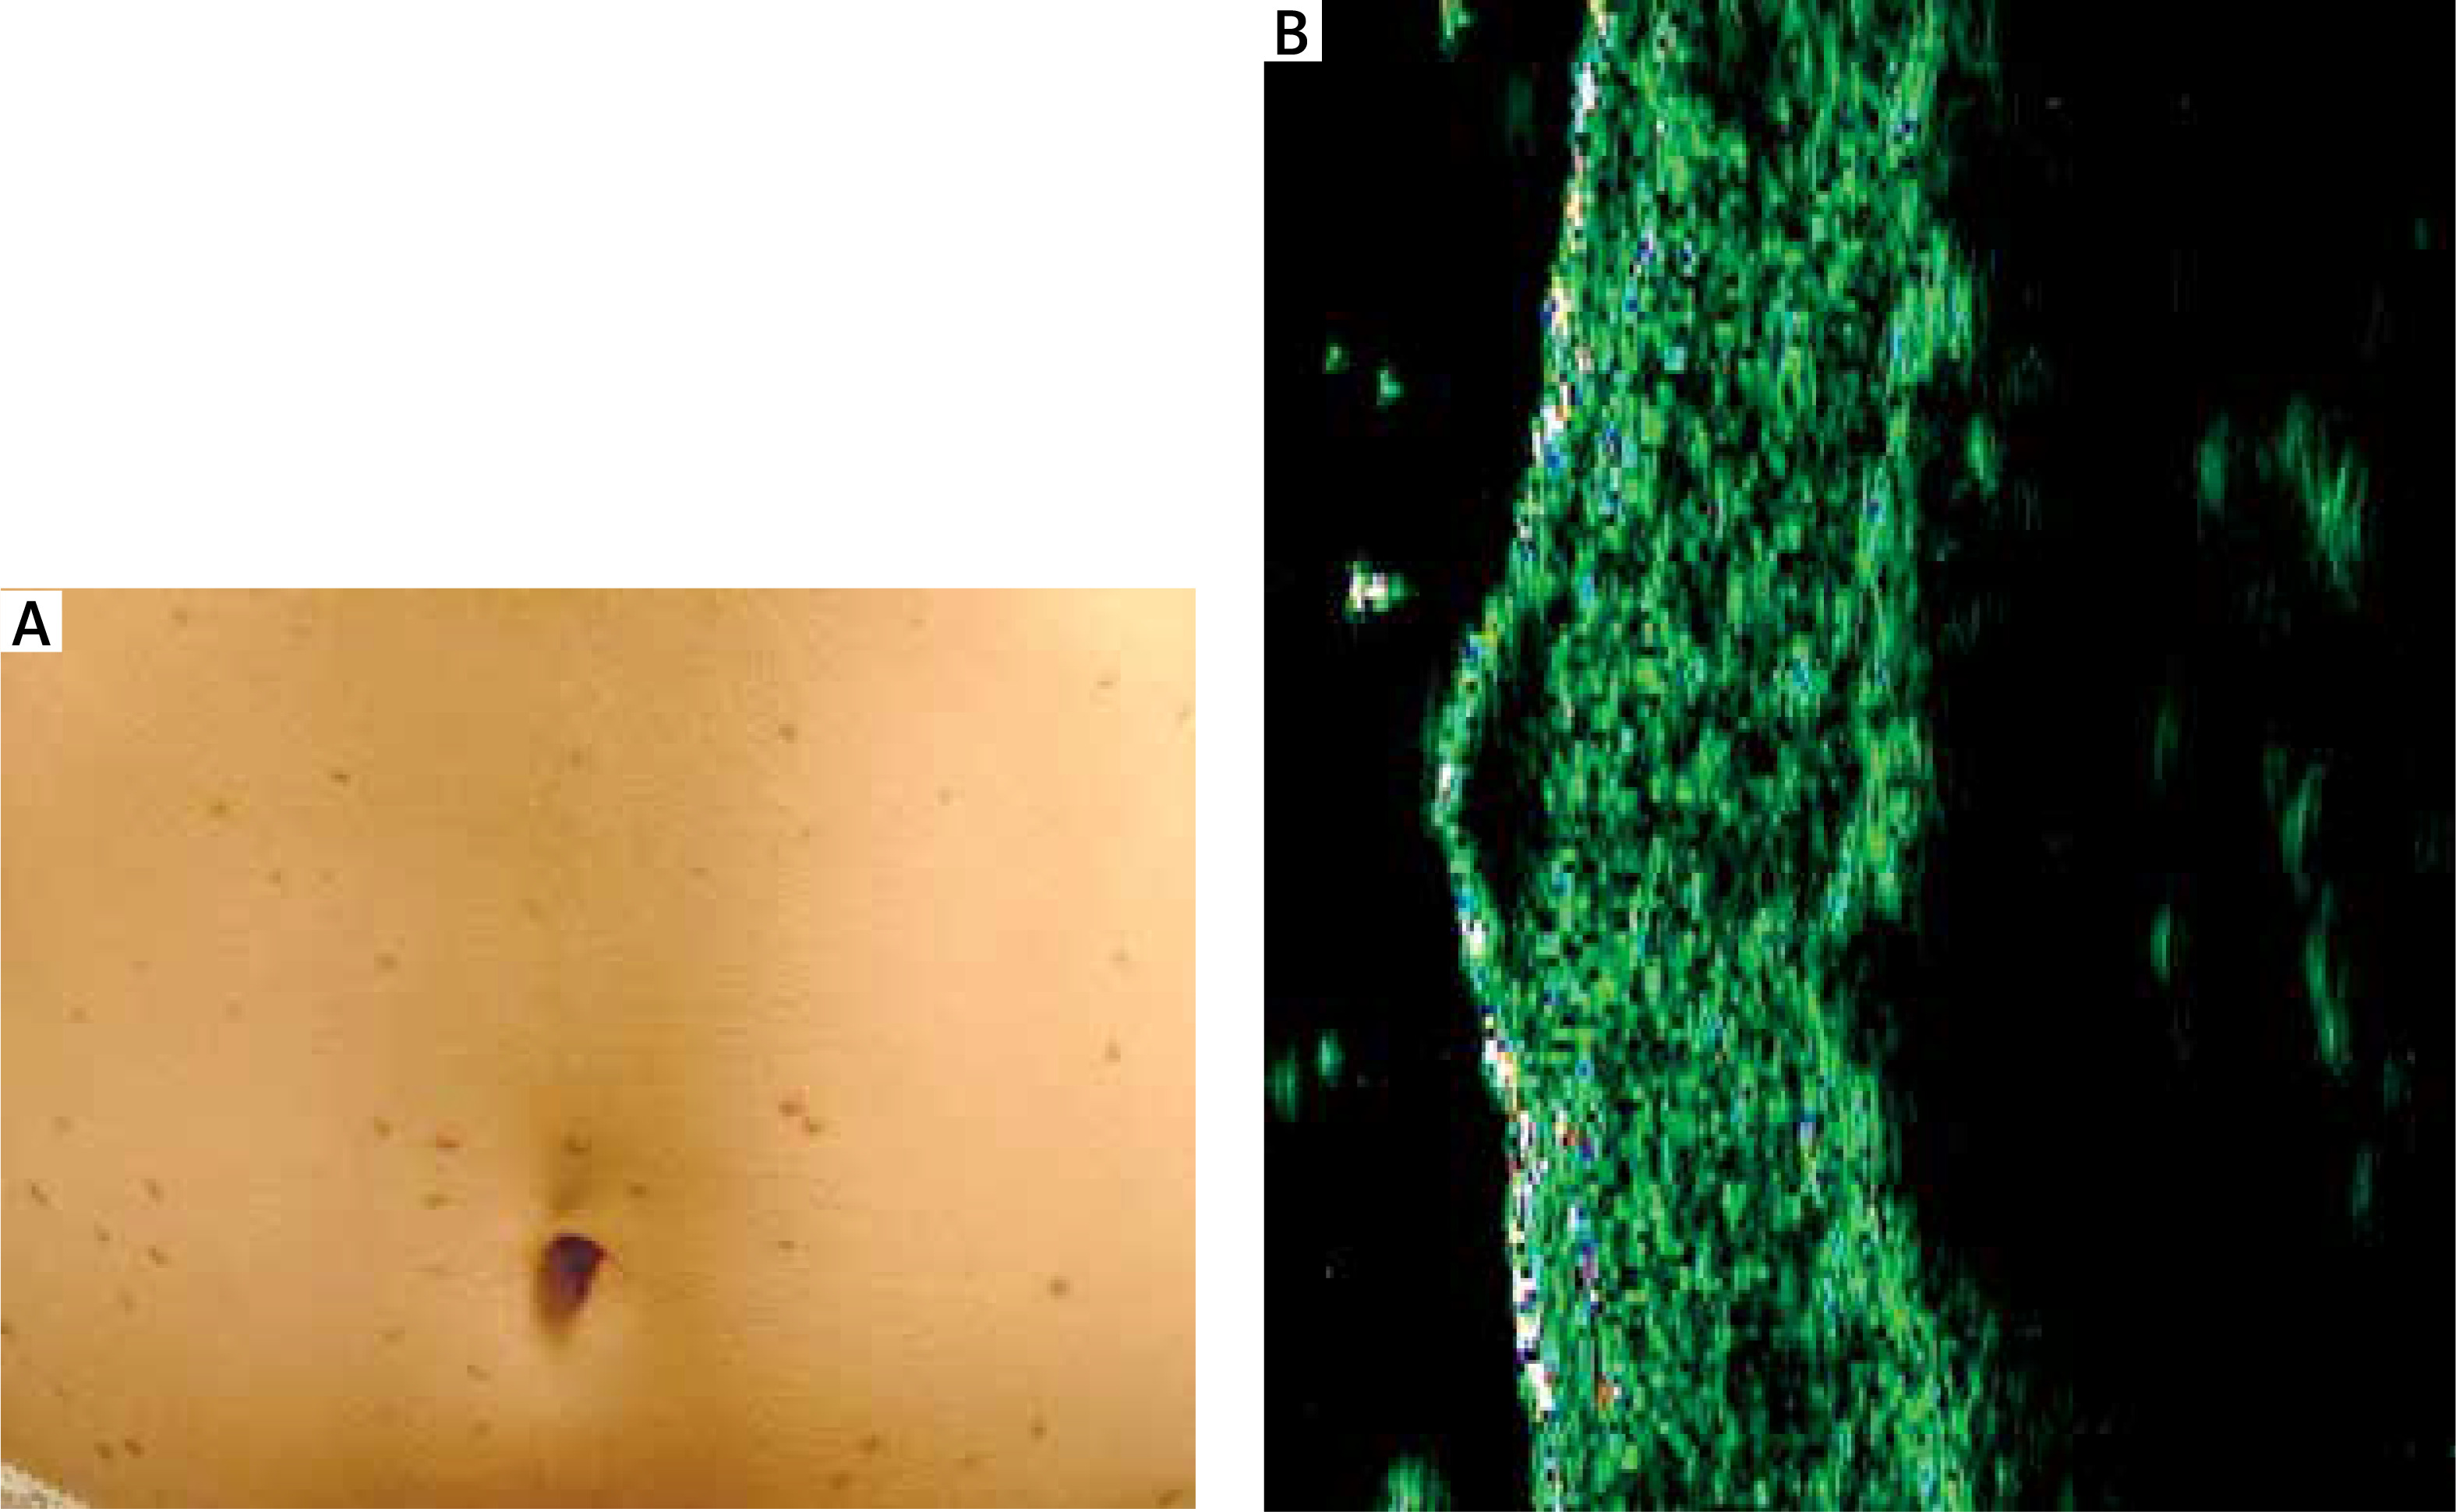
A – Taberna pro medicum GmbH (tpm) (Lüneburg, Germany) ultrasound scanner. Examination of skin changes: the transducer in a horizontal position applied to the patient’s skin. B – Taberna pro medicum GmbH (tpm) (Lüneburg, Germany) ultrasound scanner. Examination of skin changes: the transducer in a horizontal position applied to the patient’s skin
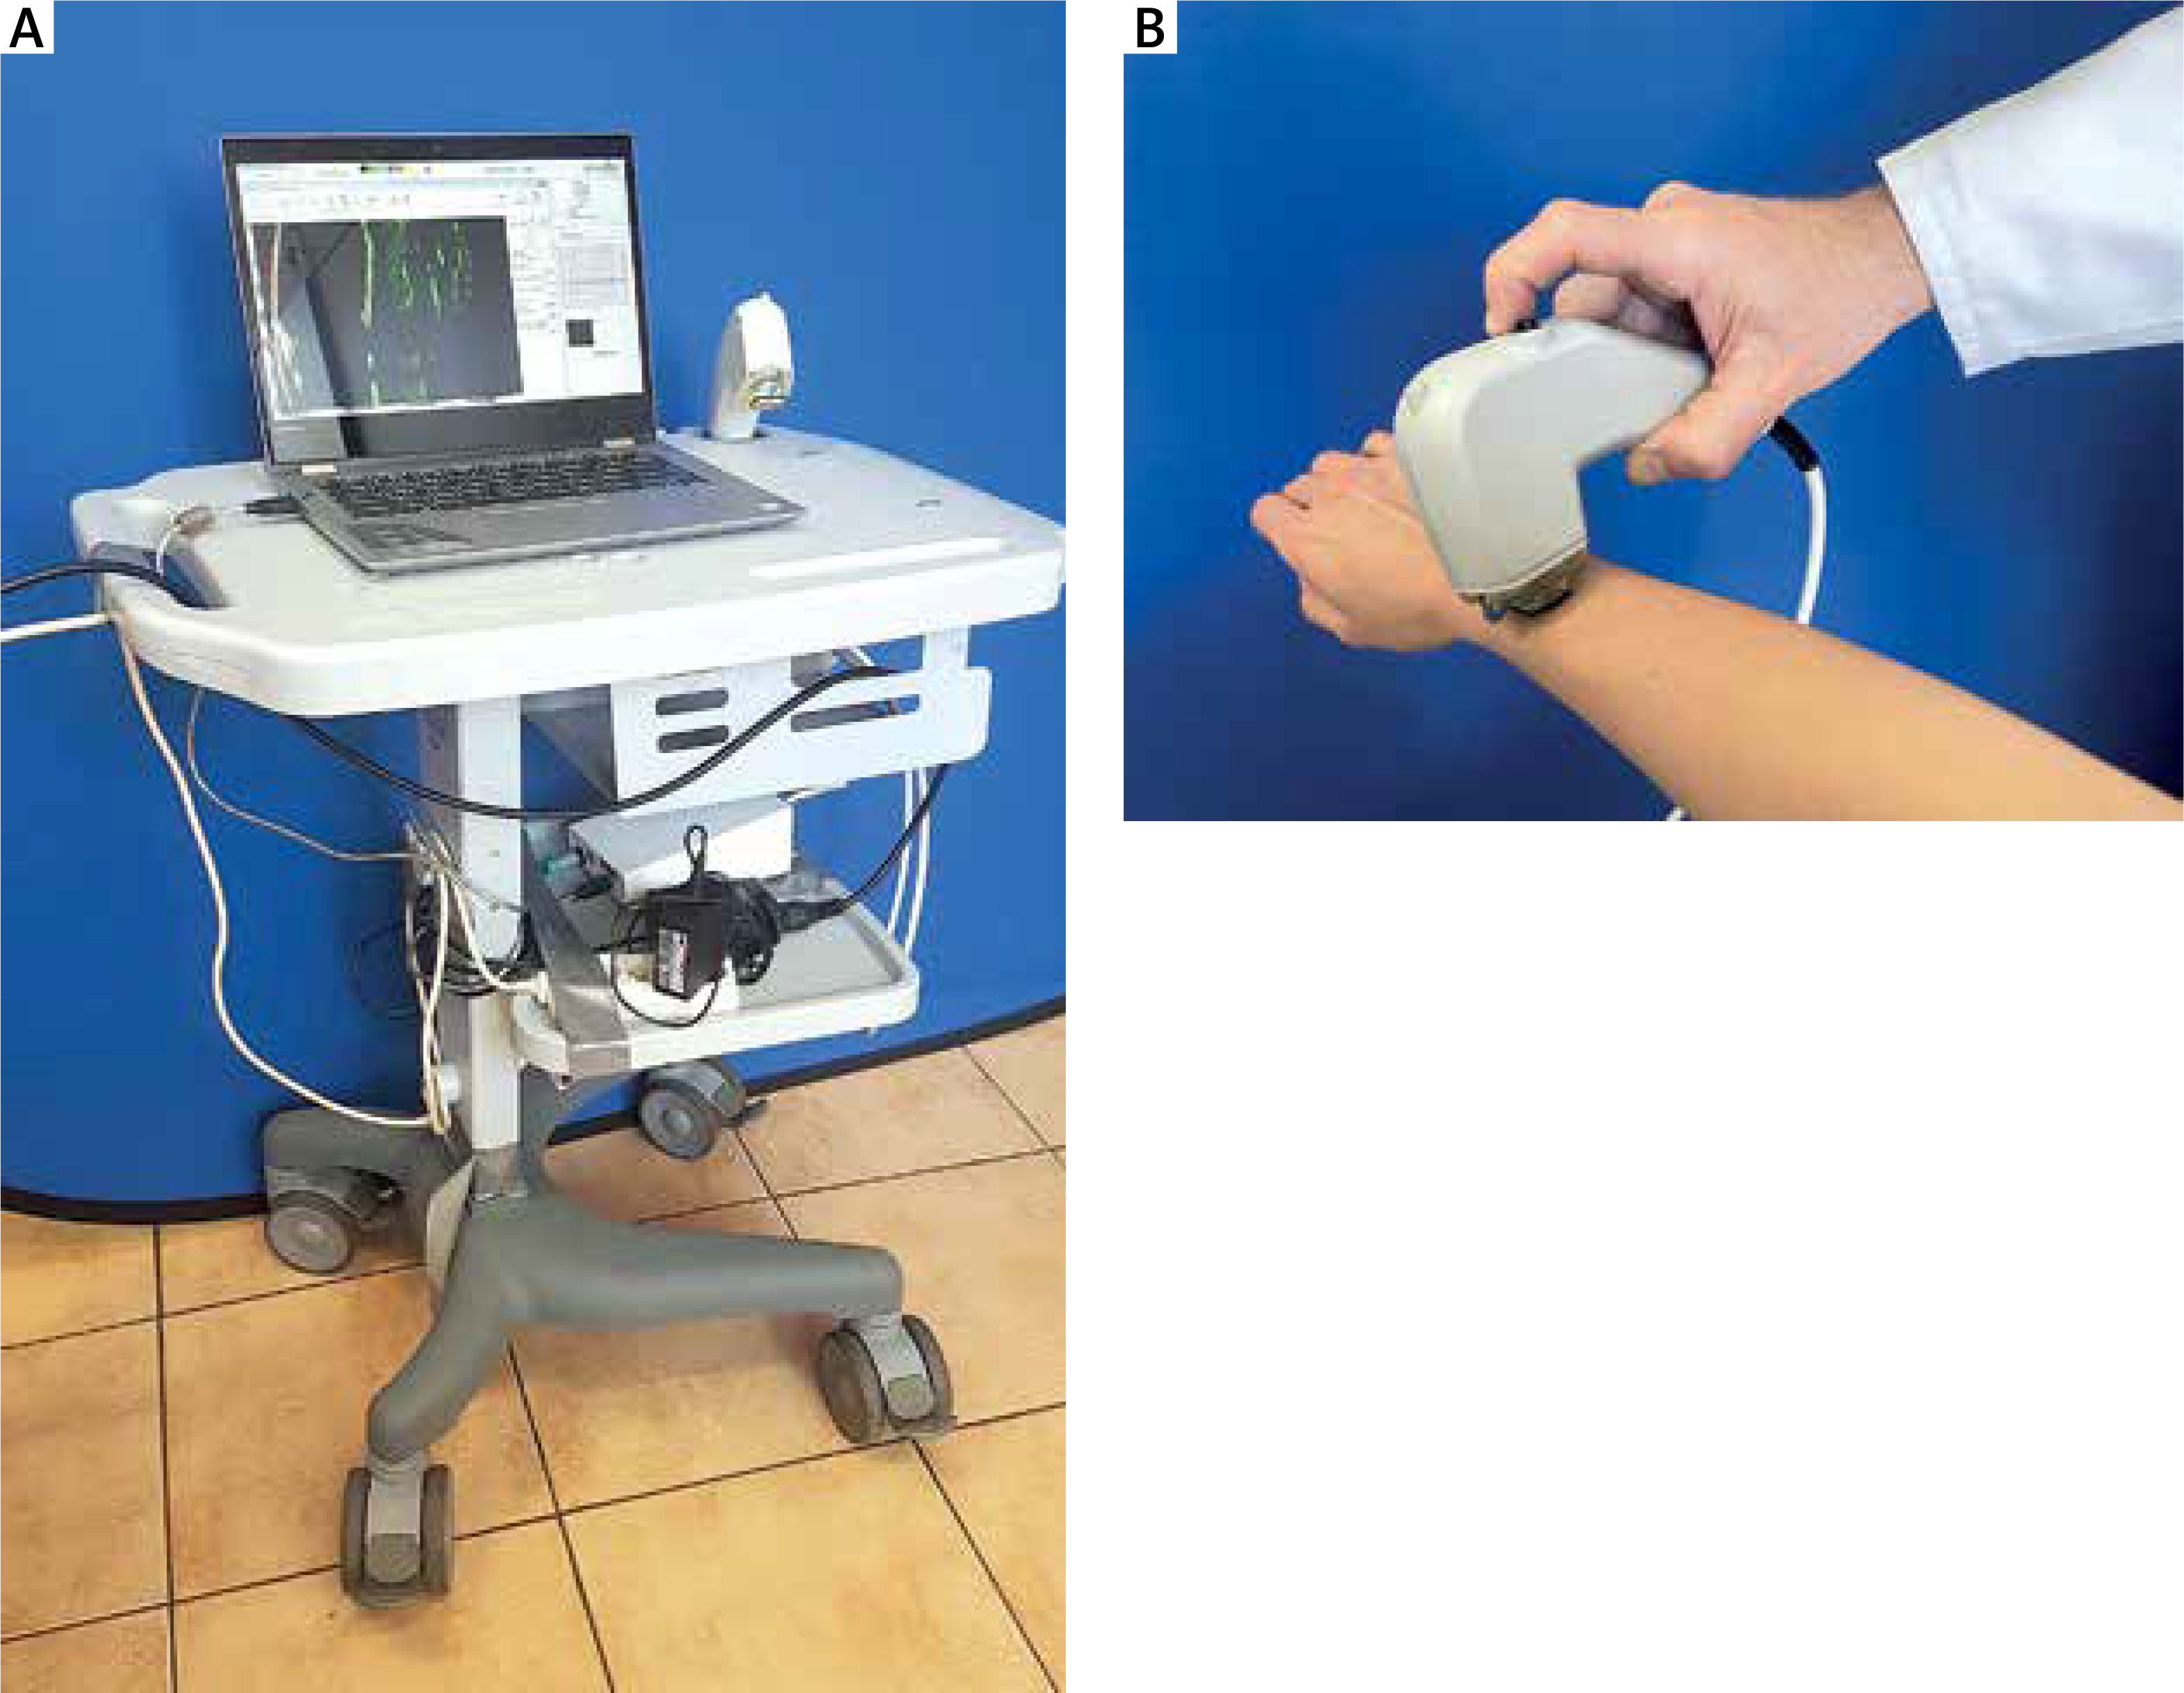
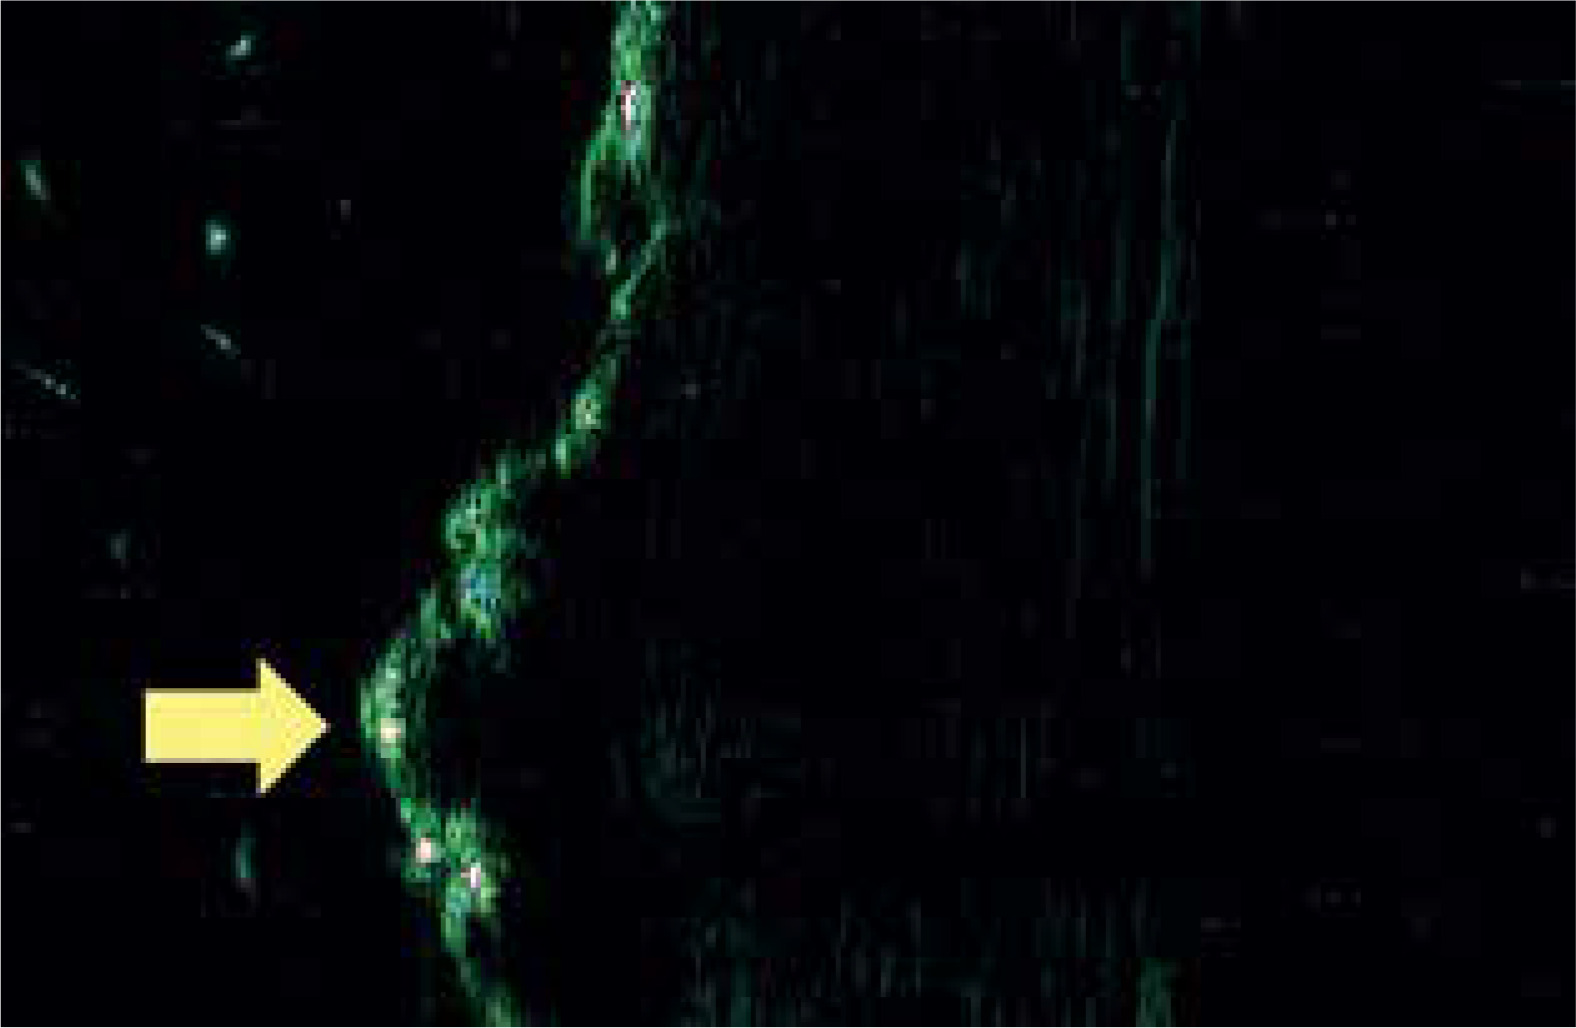
Figure 2
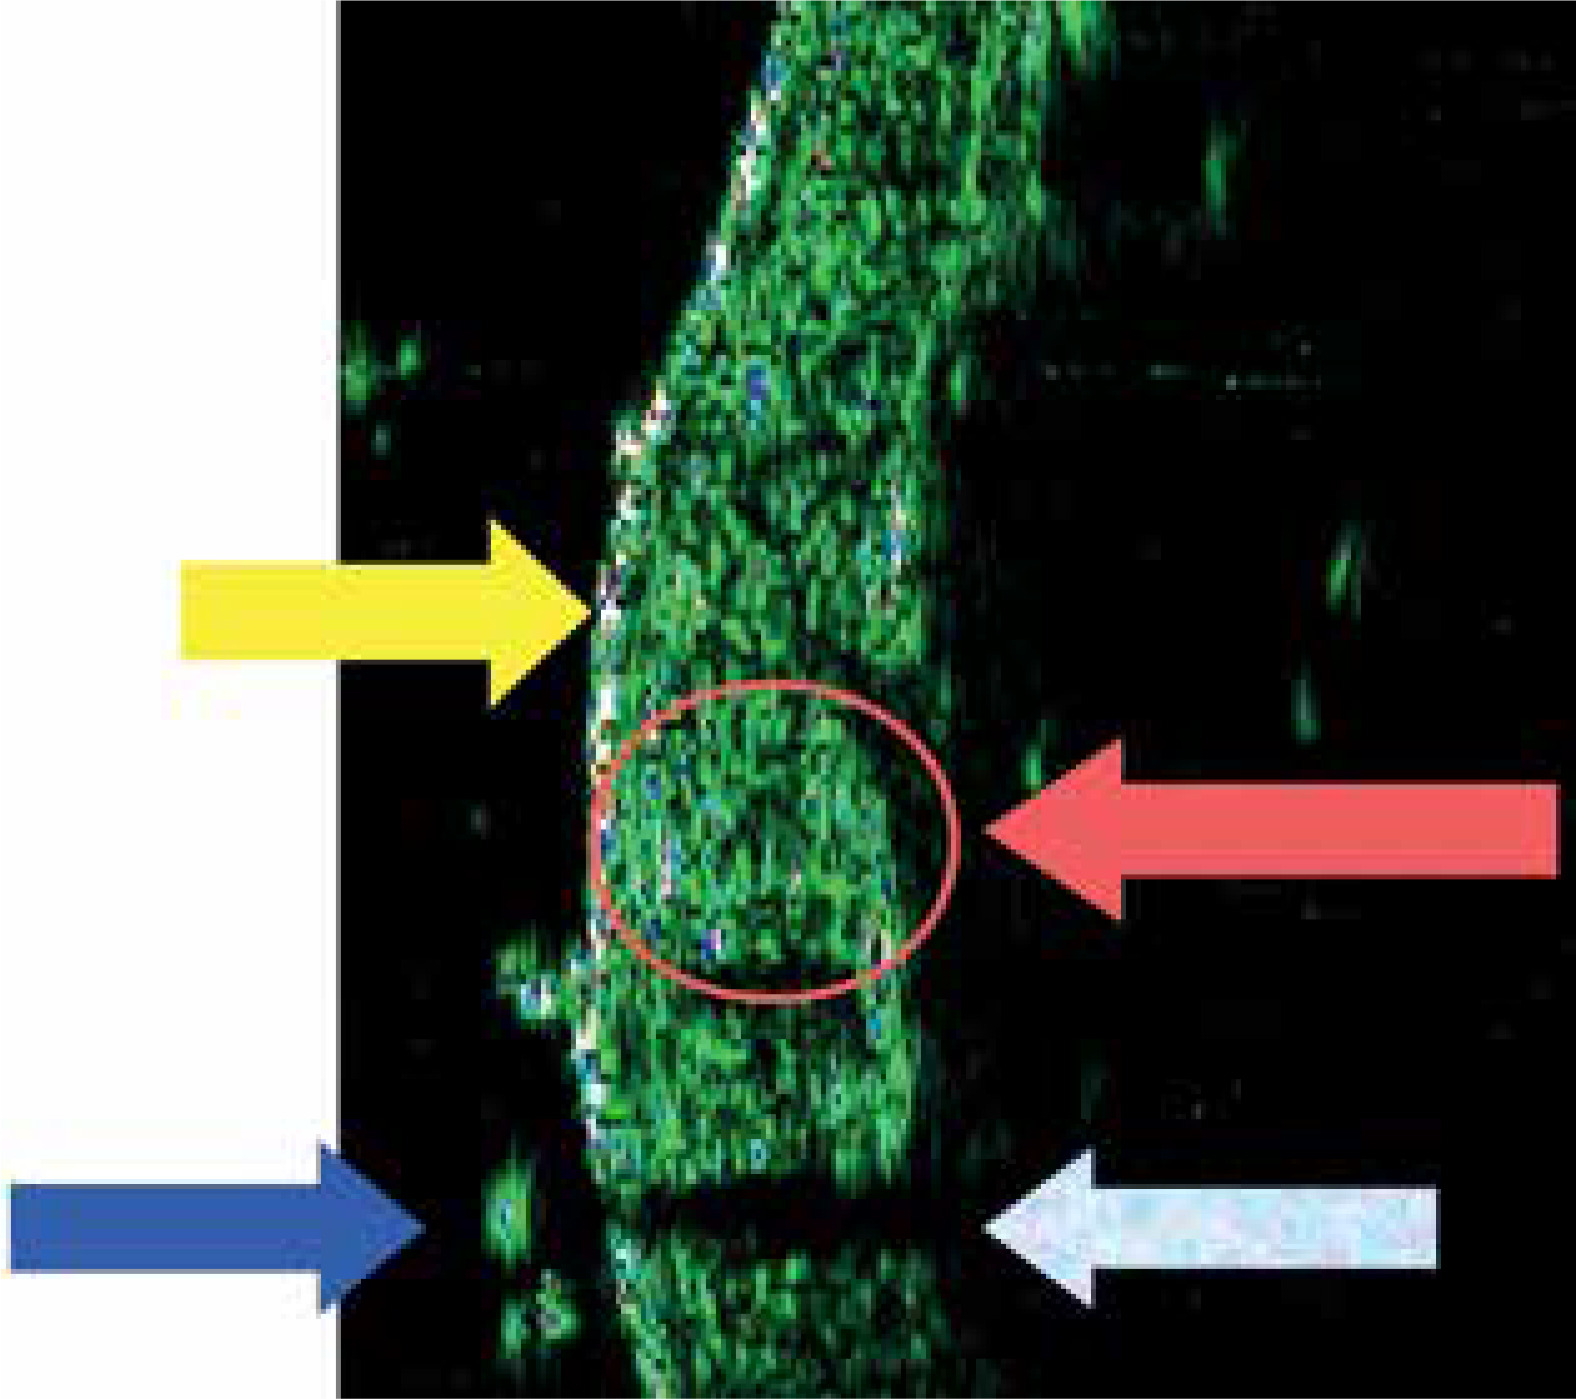
Sonographic image of normal skin (22.5 MHz): abdomen, thickness 1422 μm. (Marked: entry zone, hair, dermal echo and acoustic shadow)
Ultrasonography in medicine
Ultrasonography, a non-invasive and ubiquitously available imaging technique, is paramount in multifarious medical domains for diagnostic endeavours. It fundamentally hinges on the computational interpretation of echoic patterns emanating from the interplay of acoustic waves with the target tissues [1]. The predominant ultrasonographic display paradigms encompass the A-mode (Amplitude) and B-mode (Brightness). The former aids in the quantification of distances between designated anatomical landmarks, thereby permitting the delineation of metrics such as dermal layer thickness. In contrast, the B-mode proffers a computationally synthesized visualization of tissues in the trajectory of the acoustic waves (Figure 2) [1–4].
In dermatology, high-frequency ultrasound imaging using waves with a frequency of approximately 20–22.5 MHz was initially employed in the 1980s by Zacarian [4] and Reid [5]. Their studies focused on evaluating skin thickness using ultrasound devices originally designed for ophthalmic imaging purposes. Since then, this technique has undergone ongoing investigation and refinement in numerous dermatological centres. As early as 2003, a dedicated skin ultrasound department was established in the Department of Dermatology, Venereology, and Allergology at the University of Wroclaw, Poland [6].
Aim
The aim of the study is to elucidate the prospective utility of HFUS in the realms of diagnosis, diagnostic evaluation, therapeutic monitoring, and remission assessment among patients afflicted with dermatological conditions. We posit that HFUS is poised to attain a level of ubiquity among dermatologists comparable to the presently entrenched of dermatoscopes. Consequently, we have undertaken this review with the objective of methodically organizing extant knowledge in this domain to promote the use of HFUS in the daily clinical practice of dermatologists.
Material and methods
In this study, we articulate our empirical investigations involving HFUS, alongside a comprehensive systematic review of extant literature within the PubMed database inception to 8 October 2023 with phrases “dermatology” AND “HFUS” and “HFUS”. We focused primarily on studies presenting our own experience with HFUS within the scope of the most common dermatological diseases and the most frequent procedures in aesthetic medicine.
Sonographic examination of the skin (HFUS)
Sonographic examinations of the skin (HFUS) were performed at the Department of Dermatology, Venereology, and Allergology in Wroclaw, utilizing a taberna pro medicum GmbH (tpm) device (Lüneburg, Germany) (Figure 1). The device is equipped with a transducer that emits and analyses acoustic waves at a frequency of 22.5 MHz. The transducer evaluates a tissue space with a width of 100 µm and a length of 12.8 mm. It declares a tissue penetration depth of up to 8 mm, with a vertical (axial) resolution of 80 µm and a horizontal (lateral) resolution of 200 µm. Data acquisition and storage are facilitated using the DUBmicro®tpm computer software. Echogenicity measurements of structures were assessed in both A-mode and B-mode. Densitometric values were defined as the average amplitude reflection height in a normalized scale of 255 horizontal amplitude levels. Hyperechoic structures were represented by bright colours in B-mode, while hypoechoic structures were depicted by dark colours (Figure 2) [6–8].
Results
HFUS image of cutaneous appendages
In the retrospective study conducted by Wortsman et al. [7], an exhaustive examination was conducted to elucidate the intrinsic morphological attributes of hair follicles and their associated tracts, sebaceous glands, Montgomery glands, apocrine glands, and arrector pili muscles. The study outcomes conclusively demonstrated the perceptible visualization of these pilosebaceous and adnexal constituents through the application of advanced high-frequency imaging techniques.
HFUS image of normal skin
The sonographic profile of physiological skin during HFUS evaluations has been meticulously delineated across an array of original and review papers (Figure 2) [1–3, 6, 8–16]. The introductory echogenic zone, which predominantly corresponds to the epidermal layer, is characterized by heightened echogenicity, substantially surpassing that of the subjacent dermis. The dermal stratum, ensconced beneath this introductory echogenic zone, manifests as an echogenic band, the magnitude of which oscillates depending on the precise anatomical locale under assessment [1–3, 6–16]. Ensuing this layer, a perceptible – though inconstant – demarcation interfacing the dermis and subcutaneous compartment becomes evident [9]. In scenarios manifesting cellulite, stark morphological aberrations are palpable [17]. The subcutaneous stratification is typified by a hypoechoic signature in ultrasonographic depictions. Furthermore, at particular anatomical sites, the employment of high-frequency ultrasound transducers facilitates the visualization of fascial delineations, with these manifesting as markedly echogenic structures, a phenomenon acutely observable in the volar facet of the wrist [17].
HFUS image in selected skin lesions
The authors have presented descriptions of HFUS images in selected dermatological conditions. These images hold a significant diagnostic value as they provide insights into the three-dimensional assessment of skin lesions. Such assessments are crucial for determining the severity of changes and serve as pivotal criteria for therapeutic decision-making, particularly in the context of melanoma management.
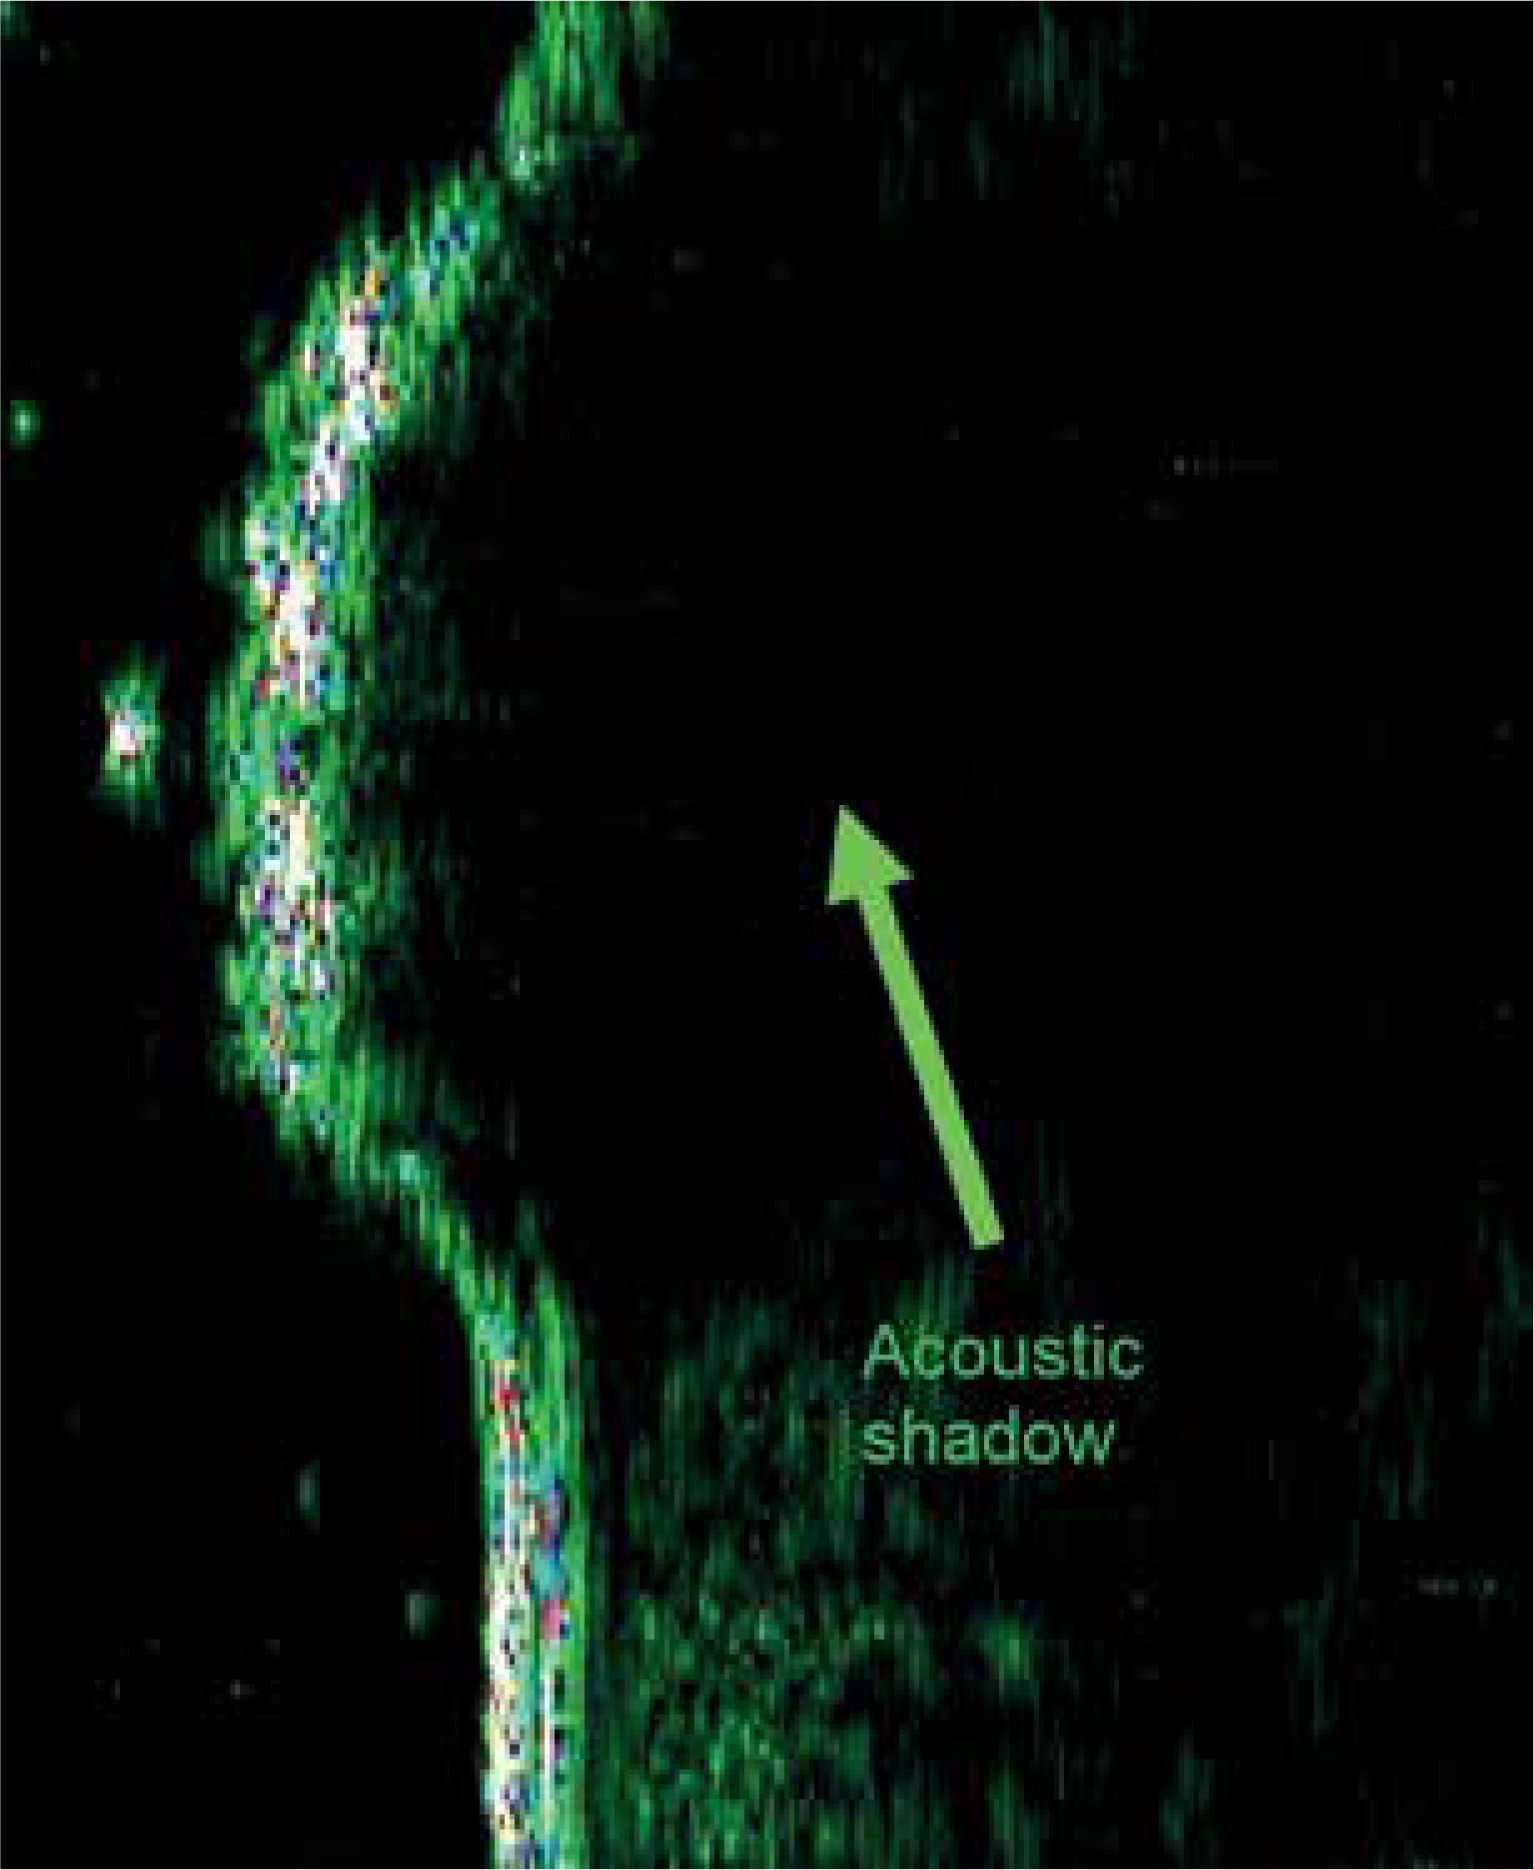
HFUS image of common viral wart (Verruca vulgaris)
Figure 3 illustrates the HFUS image of a common wart (verruca vulgaris). In the image, there is complete acoustic shadowing of the epidermal structures on the surface of the lesion, which impedes the visualization of the underlying dermis [9].
HFUS image of epidermoid cyst
HFUS has been shown to aid in differentiating epidermoid cysts from tumours by visualizing the delineating wall of the cystic structure (Figure 4). The analysis of HFUS images reveals distinct echogenicity patterns, with the highest echogenicity observed directly above the cyst, intermediate echogenicity in the adjacent unaffected skin, and the lowest echogenicity directly above the cyst wall [9].
HFUS image of morphea
HFUS evaluation of morphea demonstrates the presence of a hyperechoic echo in the entry zone. The appearance of the dermis, on the other hand, is contingent upon the stage of sclerosis. During the inflammatory stage, there is an expansion of the dermal band, whereas during the fibrotic stage, there is a constriction of the band [18].
HFUS image of progressive systemic sclerosis
In patients diagnosed with progressive systemic sclerosis (PSS), there is a demonstrable hypertrophy of the cutaneous layer interjacent the nail fold and the distal interphalangeal joint of the third digit. Such phenotypic manifestations are conspicuously absent in normative individuals [18].
HFUS image of lichen sclerosus and lichen atrophicus
The investigation conducted by Chen et al. [18] highlighted the efficacy of HFUS in distinguishing between morphea and lichen sclerosus et atrophicus. In the case involving a 54-year-old Japanese female, prior to biopsy, a HFUS examination was performed, revealing a conspicuous subepidermal echo-lucent band spanning up to 1.2 mm, indicative of severe lymphedema. This distinct ultrasonographic observation prompted the initial exclusion of morphea as a potential diagnosis, leading to a preliminary identification of lichen sclerosus et atrophicus. Subsequent histopathological analysis validated the inferences drawn from the ultrasonographic assessment.
Later, in a comprehensive investigation spearheaded by Bia³ynicki-Birula et al. [19] at the Department and Clinic of Dermatology, Venereology, and Allergology in Wroclaw, the team elucidated a distinctive sonographic hallmark observed in a cohort of 4 patients diagnosed with lichen sclerosus. The salient ultrasonographic manifestation, discerned in lichen sclerosus and atrophicus lesions located on the trunk and extremities, comprised a hyperechoic, expanded, and sinuous resonance within the introductory zone (Figure 5). Such an observation possesses profound diagnostic implications, particularly in distinguishing lichen sclerosus from circumscribed systemic sclerosis.
Comparative HFUS image of selected sclerotic dermatoses
The research conducted by Marti-Marti et al. [20] encompassed a comprehensive cohort of 72 patients exhibiting a spectrum of sclerotic dermatoses: morphoea, progressive systemic sclerosis (PSS), and chronic graft-versus-host disease (cGvHD). This cohort comprised 31 cases of morphea, 19 cases of PSS, and 22 cases of cGvHD. Employing HFUS as the diagnostic modality, the investigation aimed to delineate distinctive HFUS manifestations within these dermatopathological entities.
HFUS-activated morphea lesions consistently exhibited a notable augmentation in vascularity. Likewise, HFUS-activated PSS cases were typified by conspicuous dermal thickening and dermal hypoechogenicity. In contrast, HFUS-activated presentations of cGvHD were characterized by pronounced dermal thickening, a blurred dermal-hypodermal junction, and prominent indicators of panniculitis in 80% of cases, along with heightened vascularity observed in 70% of cases.
Of significance, the study unveiled cases of disparity between clinical evaluation and HFUS assessment of disease activity, a phenomenon observed in 23.6% of cases. Subsequent therapeutic interventions were instituted based on insights gleaned from HFUS findings, resulting in clinical management adjustments for 19.4% of patients. These modifications entailed discontinuation of treatment in approximately every second patient, initiation of therapy in every third patient, alteration of medication, and execution of a cutaneous biopsy in every tenth patient.
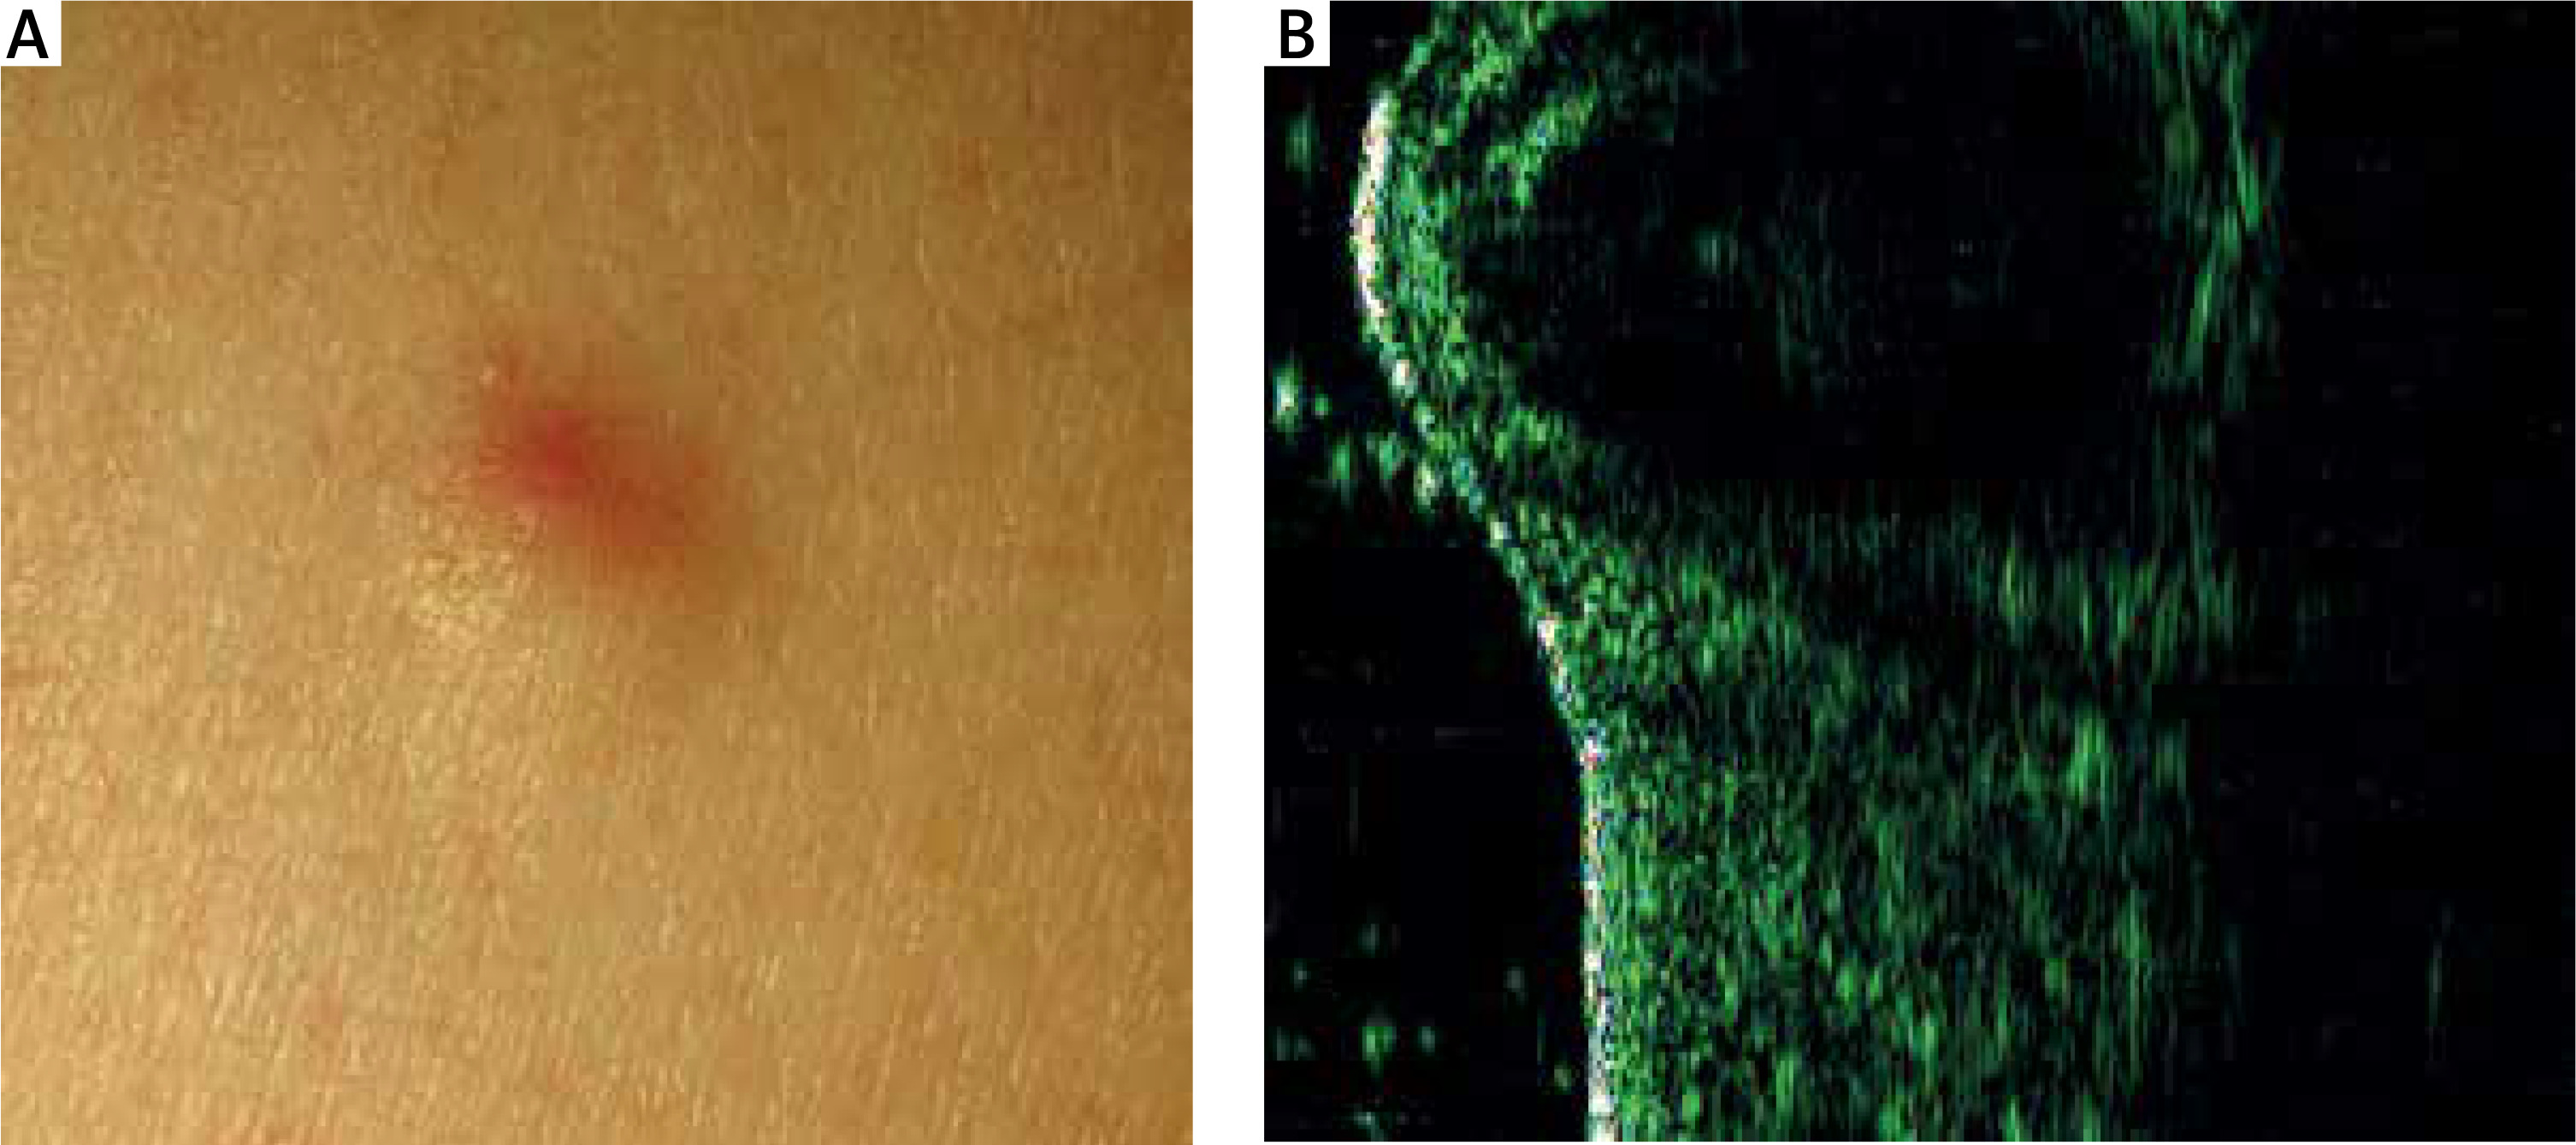
HFUS image of maculopapular cutaneous mastocytosis – two types of sonographic images
In a subsequent investigation helmed by Białynicki-Birula et al. [21], maculopapular cutaneous mastocytosis was discerned to manifest in two distinct sonographic profiles. The primary profile illustrated an augmented and hypoechoic region within the dermis, typifying the sporadic infiltration of mast cells and attenuated echogenicity. In contrast, the secondary profile portrayed a fusiform configuration situated subepidermally, manifesting a quintessential cellular infiltration pattern (Figure 6). It is noteworthy to highlight that patients exemplifying the latter sonographic pattern manifested a more pronounced amelioration post-PUVA therapy (comprising 12 sessions) in comparison to the diffuse variant.
HFUS image of malignant melanoma
In HFUS examination, melanoma is predominantly visualized as a hypoechoic region resembling a bilaterally convex lens. It typically occupies the dermal-epidermal junction and exhibits variations in appearance based on its thickness, presence of ulceration, and anatomical location. Preoperative ultrasonographic evaluation of melanoma is a standard practice in developed countries’ oncology centres, enabling precise in vivo measurements. These measurements play a crucial role in determining the appropriate management strategy for the patient [22, 23].
HFUS image of non-melanoma skin cancer
In cases involving basal cell carcinoma (BCC), there is notable detection of heightened entry echoes. Additionally, distinct subtypes of BCC may exhibit the presence of finely dispersed hyperechoic structures uniformly within the hypoechoic tumour region, colloquially termed as “flower cotton” [24]. BCC nodular type manifests as a lesion with hypoechoic characteristics and distinct demarcations, predominantly localized within the dermal stratum. On occasion, it may exhibit further extension into the subcutaneous tissue layer [25].
HFUS image of atopic dermatitis and atopic dermatitis treatment
Polañska et al. [26] conducted a study involving a cohort of 16 patients diagnosed with atopic dermatitis. Within this cohort, the presence of the hypoechoic band within the skin was identified in 93.7% of cases, encompassing fifteen out of the sixteen patients. Statistically significant correlations were established between the thickness of the hypoechoic band and various dermatopathological indicators, such as the extent of epidermal hyperplasia, hyperkeratosis, parakeratosis, spongiosis, and the intensity of inflammatory infiltrates. Furthermore, a strong inverse relationship was observed between skin echogenicity and the intensity of inflammatory infiltrates.
In an alternative study, Polañska et al. [27] conducted a sonographic monitoring of dermatological alterations in patients diagnosed with atopic dermatitis who were undergoing a therapeutic regimen involving tacrolimus. The study commenced with a cohort of 39 patients, with 22 individuals (constituting 54.6%) successfully completing the study. Among the initial 39 patients, a substantial proportion of 31 individuals (accounting for 79.5%) received a proactive treatment regimen spanning a minimum of 4 weeks. Noteworthy statistical shifts were discerned in key parameters including the Investigator’s Global Assessment (IGA), the mean Subepidermal Low-Echo Band (SLEB) value, and Trans-Epidermal Water Loss (TEWL) throughout the course of therapy. Furthermore, statistically significant disparities were observed in mean SLEB and TEWL values between measurements obtained from lesional and non-lesional regions.
HFUS image of psoriasis vulgaris and psoriasis vulgaris treatment
German researchers have elucidated an amplification and heightened echogenicity of the entry zone in conjunction with a hypoechogenic domain situated within the superior dermal strata in active psoriatic plaques. Remarkably, these observed ultrasonographic attributes underwent concurrent diminution, aligning with the clinical amelioration achieved post-phototherapy interventions [28].
In the study conducted by Polañska et al. [29], a group of 58 patients diagnosed with chronic plaque psoriasis were included. These individuals were exposed to two distinct treatment approaches: firstly, a topical emollient containing a binary formulation of calcipotriol (50 µg/g) and betamethasone dipropionate (0.5 mg/g); secondly, narrowband ultraviolet B (NB-UVB) phototherapy set at 311 nm. An assessment of disease severity was carried out both at the commencement and conclusion of the intervention period, employing metrics such as the Psoriasis Area and Severity Index (PASI), the Target Lesion Score (TLS), as well as HFUS.
The outcomes of this investigation underscored a notable and statistically significant reduction in PASI scores. Specifically, the cohort administered with the calcipotriol/betamethasone formulation experienced an 85% decrease, while the NB-UVB treated group exhibited an 82% reduction. Importantly, both therapeutic regimens induced a substantial decrease in the thickness of the SLEB. Remarkably, there were no statistically significant inter-group variances concerning the extent of proportional SLEB reduction [29].
HFUS image of hidradenitis suppurativa
The research conducted by Oranges et al. [30] entailed a comprehensive ultrasonographic investigation of 50 patients afflicted with hidradenitis suppurativa. HFUS unveiled fluid collections characterized by heterogeneous hypoechoic oval lesions. The tunnels were observed as hypoechoic lesions with a band-like appearance in the longitudinal view, and as circular formations in the transverse view. Bridge scars were identified as isoechoic lesions exhibiting well-defined borders, manifesting as elevated structures on the skin surface.
Pseudocysts were characterized by distinct oval or circular formations exhibiting anechoic or hypoechoic properties, often accompanied by the presence of hyperechoic walls.
HFUS image of CTCL
Yazdanparast et al. [31] conducted a study involving a cohort of 21 patients diagnosed with cutaneous T-cell lymphoma (CTCL). HFUS examination revealed noteworthy variations in hydration, pH, melanin content, and erythema index between the affected lesion sites and unaffected skin regions. Furthermore, the dermal echo density within CTCL lesions was markedly diminished in comparison to adjacent normal skin areas. These findings emphasize the potential utility of HFUS as an accessible and cost-effective tool for diagnostic assessment and longitudinal monitoring of CTCL.
The investigation conducted by Polañska et al. [32] showed the clinical relevance of evaluating the SLEB parameter through HFUS in the context of CTCL patients. The study unveiled a noteworthy reduction in SLEB thickness within the subset of patients undergoing phototherapy, thereby implying the potential utility of monitoring this parameter as an instrumental approach for gauging the effectiveness of therapeutic interventions in the CTCL population.
In a study conducted by Niu et al. [33], involving a cohort of 62 patients presenting with erythema and scales, the investigation of epidermal thickness and SLEB thickness demonstrated notable diagnostic significance in the differential diagnosis of early-stage mycosis fungoides from psoriasis vulgaris and eczema. The study conducted by Polañska et al. [27] demonstrated the significance of the SLEB parameter, measured using HFUS, in patients with CTCL. The investigation observed a notable decrease in SLEB thickness among patients undergoing phototherapy, implying that monitoring this parameter in CTCL patients could serve as a valuable tool for assessing the efficacy of treatment interventions.
In a study conducted by Wohlmuth-Wieser et al. [34] comprising a cohort of 13 patients, HFUS examination demonstrated an augmented epidermal thickness in individuals diagnosed with CTCL and psoriasis when compared to those with atopic dermatitis. Their observations indicate conspicuous dermal infiltration and heightened dermal thickness in regions affected by Sézary syndrome, thereby accentuating the informative capacity of HFUS in delineating disease-associated alterations.
Conclusions
HFUS examination of cutaneous lesions is a non-invasive and repeatable method that is associated with no complications to patients. When performed by experienced specialists, it provides an objective assessment of skin conditions [1–3, 6, 8–16]. Familiarity with characteristic sonographic patterns associated with specific dermatoses can greatly expedite the diagnostic process [18, 19]. Notably, HFUS facilitates the assessment of disease severity and depth of infiltration in proliferative disorders like psoriasis, while also enabling the discrimination of distinct structures such as cysts and tumours [9, 23]. Moreover, skin ultrasonography has been integrated into routine clinical practice in developed nations since the 1990s, offering valuable preoperative insights into tumour depth in melanoma cases, as well as aiding in the evaluation of inflammatory activity and cutaneous fibrosis in systemic sclerosis and localized scleroderma [1, 2, 9, 23]. HFUS imaging has certain limitations. The acoustic waves employed in ultrasound technology yield images with lower resolution compared to those obtained using electromagnetic waves. When performing HFUS examination, the epidermis can only be assessed indirectly as the entry zone, utilizing a 22 MHz frequency transducer. Similarly, the subcutaneous tissue can only be evaluated at the dermal-subcutaneous tissue interface, providing valuable insights into conditions like cellulite [17]. It is important to note that skin ultrasound, in isolation, does not confer diagnostic authority but can expedite the diagnostic process. HFUS examination allows for the evaluation of dermal thickness in living organisms, providing insights into changes in skin thickness influenced by diurnal variations and pharmacological interventions. It is important to highlight that histopathological analysis typically underestimates skin thickness due to fluid loss during specimen processing procedures [9]. Proficiency in the precise ultrasonographic evaluation of the skin requires extensive training and practical experience. Nevertheless, owing to its objectivity, capacity for multiple measurements, cost-effectiveness following equipment acquisition, and patient safety, skin ultrasonography has emerged as an essential element in the 21st-century dermatological diagnostics [1, 2, 9, 18–34].