


Introduction
Hepatocellular carcinoma (HCC) is the most common primary malignant neoplasm of the liver, with increasing incidence, and the third leading cause of cancer-related deaths worldwide [1-4].
The curative approaches comprise surgical resection, liver transplantation and tumor ablation. However, most patients remain inoperable at the time of diagnosis due to tumor extension or metastases and they are often prone to recurrence [5]. Early and correct diagnosis based on imaging modalities is crucial for correct patient treatment.
The evidence of microvascular invasion (MVI) is of great clinical relevance due to its correlation with early tumor recurrence and is associated with a worse prognosis [1, 5]. Therefore, a preoperative statement regarding the presence of MVI would be of great benefit for optimal treatment planning. MVI status can only be determined by histopathological examination [1].
However, HCC is the only malignant tumor for which a non-invasive imaging-based diagnosis can be made [1, 3]. Thus, biopsy can be omitted when typical radiological HCC features are seen on computed tomography (CT) and magnetic resonance imaging (MRI), which is characterized by hypervascularized contrast enhancement in the arterial phase followed by washout in the portal venous phase [3].
Especially for very small lesions, the sensitivity of dynamic contrast-enhanced features is only up to 60% [3]. In this regard, diffusion-weighted imaging (DWI) has proven to be an excellent tool in the detection and characterization of focal liver lesions with increasing clinical accuracy in recent years [6, 7]. Thus, both qualitative and quantitative analysis of DWI images can be performed using the high b-value images and the quantitative apparent diffusion coefficient (ADC) map.
In addition, DWI has also been shown to have the potential to predict microvascular invasion [1, 6, 8]. The possible value of DWI in patients with HCC has been evaluated extensively employing DWI sequences with high b-values up to 1000 s/mm2 [1, 8].
In the field of oncology imaging, it was demonstrated that computed diffusion-weighted imaging (c-DWI) can increase the sensitivity and accuracy for several tumors [9-14]. This mathematical post-processing technique can be used to create virtual images with high b-values using at least two different lower b-values from real acquired DWI data [15]. Thus, the scan time can be minimized while generating higher diffusion effects in high b-value images.
However, so far there been study no study to elucidate the diagnostic value of high b-value DWI in patients with HCC.
Therefore, the aim of this study was to evaluate the diagnostic benefit of high b-value c-DWI compared with acquired DWI in patients with HCC and to determine whether it could help to predict the MVI status.
Material and methods
Patient population
All patients with known HCC who underwent MRI with a field strength of 1.5 T and surgical resection between May 2014 and September 2021 were retrospectively assessed for this study.
The inclusion criteria comprised histopathological confirmation by surgery and a preoperative MRI within one month prior to the surgery.
Magnetic resonance imaging studies
Magnetic resonance imaging was conducted with a 1.5 T MR scanner (Aera, Siemens Healthcare, Erlangen, Germany). All examinations were performed according to a standardized protocol that included DWI in axial alignment and fat-saturated contrast-enhanced T1-weighted (w) images in native technique and with dynamic contrast-enhanced sequences.
DWI images were acquired with either b-values of 50, 400, and 800 s/mm2 or 50, 400, and 1000 s/mm2. Over half of the axial DWI images were obtained with the highest b-value of 800 s/mm2 (n = 20, 54%). All other DWI images were acquired with a highest b-value of 1000 s/mm2 (n = 17, 46%). Computed DWI images with higher b values of 1000, 2000, 3000, 4000, and 5000 s/mm2 were generated with the postprocessing software Philips IntelliSpace Portal (version 11; Philips, The Netherlands) using the application MR Advanced Diffusion Analysis (Philips Health System, Hamburg, Germany). This application uses the mathematic monoexponential model to generate images with high b-values. The protocol settings are listed in Table 1.
Image analysis
Axial DWI and fat-saturated contrast-enhanced T1w images were used to localize hepatocellular carcinoma. These lesions were subsequently further analyzed with axial c-DWI images.
For qualitative analysis, visual assessment was performed by an experienced radiologist (M.A. with 5 years of general radiology experience). Acquired DWI with b values of 800 or 1000 s/mm2 and c-DWI with b values of 1000, 2000, 3000, 4000, and 5000 s/mm2 were analyzed respectively. The subjective detectability of HCC at different b values was categorized as follows: (0) worse delineation, (1) same delineation, and (2) better delineation compared with surrounding tissue. Image quality was also evaluated in terms of possible artifacts. All images were compared side by side (Fig. 1).
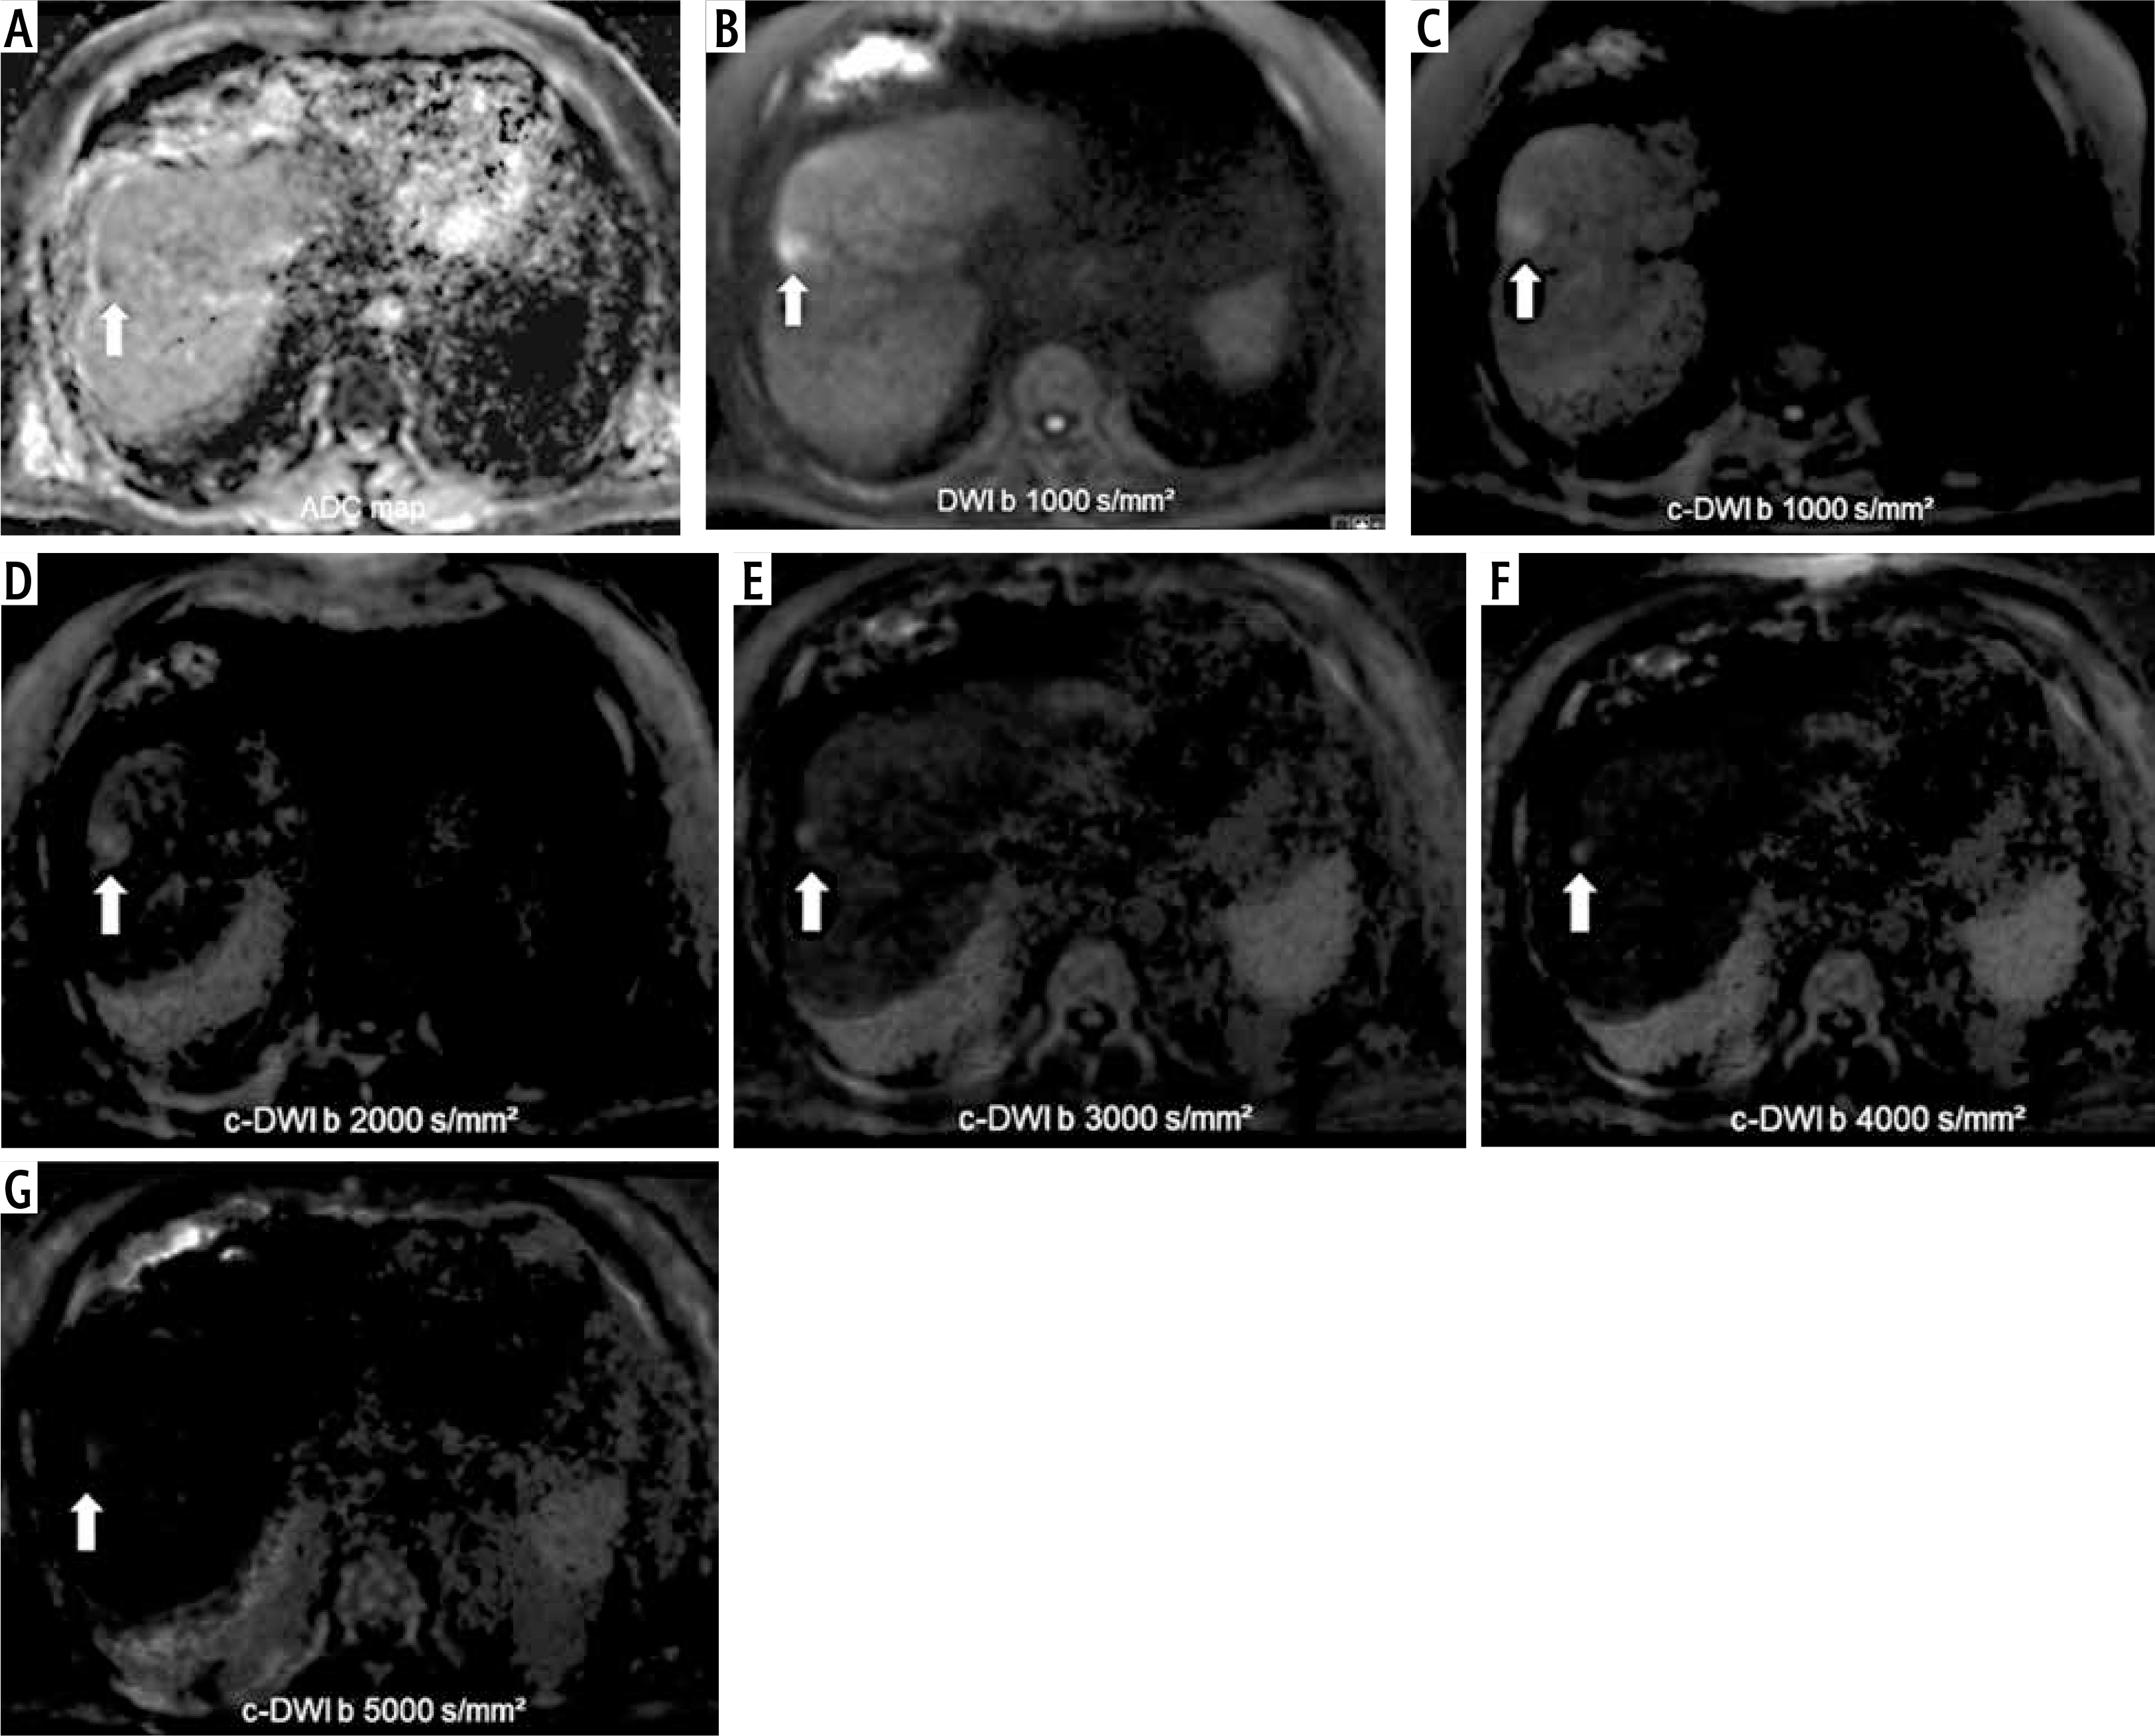
Fig. 1
Representative case of the cohort with histopathologically confirmed hepatocellular carcinoma (HCC; G2, MVI positive) (thick arrow) on ADC map (A), axially acquired diffusion-weighted imaging (DWI) (B), and computed diffusion-weighted imaging (c-DWI) at high b values of 1000-5000 s/mm2 (C-G). On DWI with a b-value of 1000 s/mm2 (B), HCC is as well visualized as on c-DWI with b-values of 1000 (C) and is better visualized than on c-DWI images at higher b-values (2000-5000 s/mm2). Starting from a high b-value of 2000 s/mm2, there is increasing deterioration of image quality. Note the corresponding low ADC value of 0.63 × 10⁻³ mm2/s of this lesion
For quantitative analysis, the computed DWI images were compared in terms of lesion volume with the acquired DWI images of b = 800/1000 s/mm2 using the Philips IntelliSpace Portal by tracing the region of interest across the entire tumor volume.
Pathological analysis
All investigated HCC patients were treated with curative intent with either segment resection or with livertransplantation. The MVI status was defined during clinical histopathological work-up. MVI status was defined by evidence of tumor cells within endothelial-lined spaces on standard hematoxylin and eosin stained slides [16].
Statistical analysis
Statistical analyses were all conducted using SPSS 29.0 (IBM SPSS Statistics for Windows, Armonk, NY: IBM Corp). First normal distribution of the data was tested using the Kolmogorov-Smirnov test. For descriptive analysis, categorical variables are reported as raw numbers and percentages. Continuous variables are displayed as mean ± standard deviation (SD) if normally distributed and median (interquartile range [IQR]) otherwise. Descriptive data were assessed using Fisher’s exact test or the Mann-Whitney U test. Spearman’s correlation analysis was performed to evaluate associations between size and DWI findings. To indicate statistical significance, a p-value < 0.05 was used in all instances.
Results
For this study, the patient sample consisted of 37 patients (7 women, 18.9%) with 37 analyzed HCC. The mean age was 63 years, ranging from 53 to 68 years. Table 2 gives an overview of the demographics of the patient cohort.
Table 2
Descriptive overview of the investigated patient sample
The majority of the tumors were located in liver segments VII and VIII (21.6%, respectively). MVI was histologically confirmed in 8 patients (21.6%). Over half of all patients (68%) were treated with liver transplantation.
All patients had liver cirrhosis as the underlying liver disease.
DWI and ADC values
Seventy-five percent of all MVI positive HCC had a high signal intensity in DWI with a corresponding decrease in the ADC compared to 48% of the MVI negative HCC group (Table 3). This difference was not statistically significant (Fisher’s exact test, p = 0.76).
Table 3
Overview of the investigated diffusion-weighted imaging (DWI) findings in hepatocellular carcinoma (HCC)
The average ADC value for all HCC was 0.91 × 10⁻³ mm2/s and ranged from 0.78 to 1.00 × 10⁻³ mm2/s. The MVI positive group had a lower ADC value compared to the MVI negative group (0.77 vs. 0.93 × 10⁻³ mm2/s, p = 0.20), but it did not reach statistical significance.
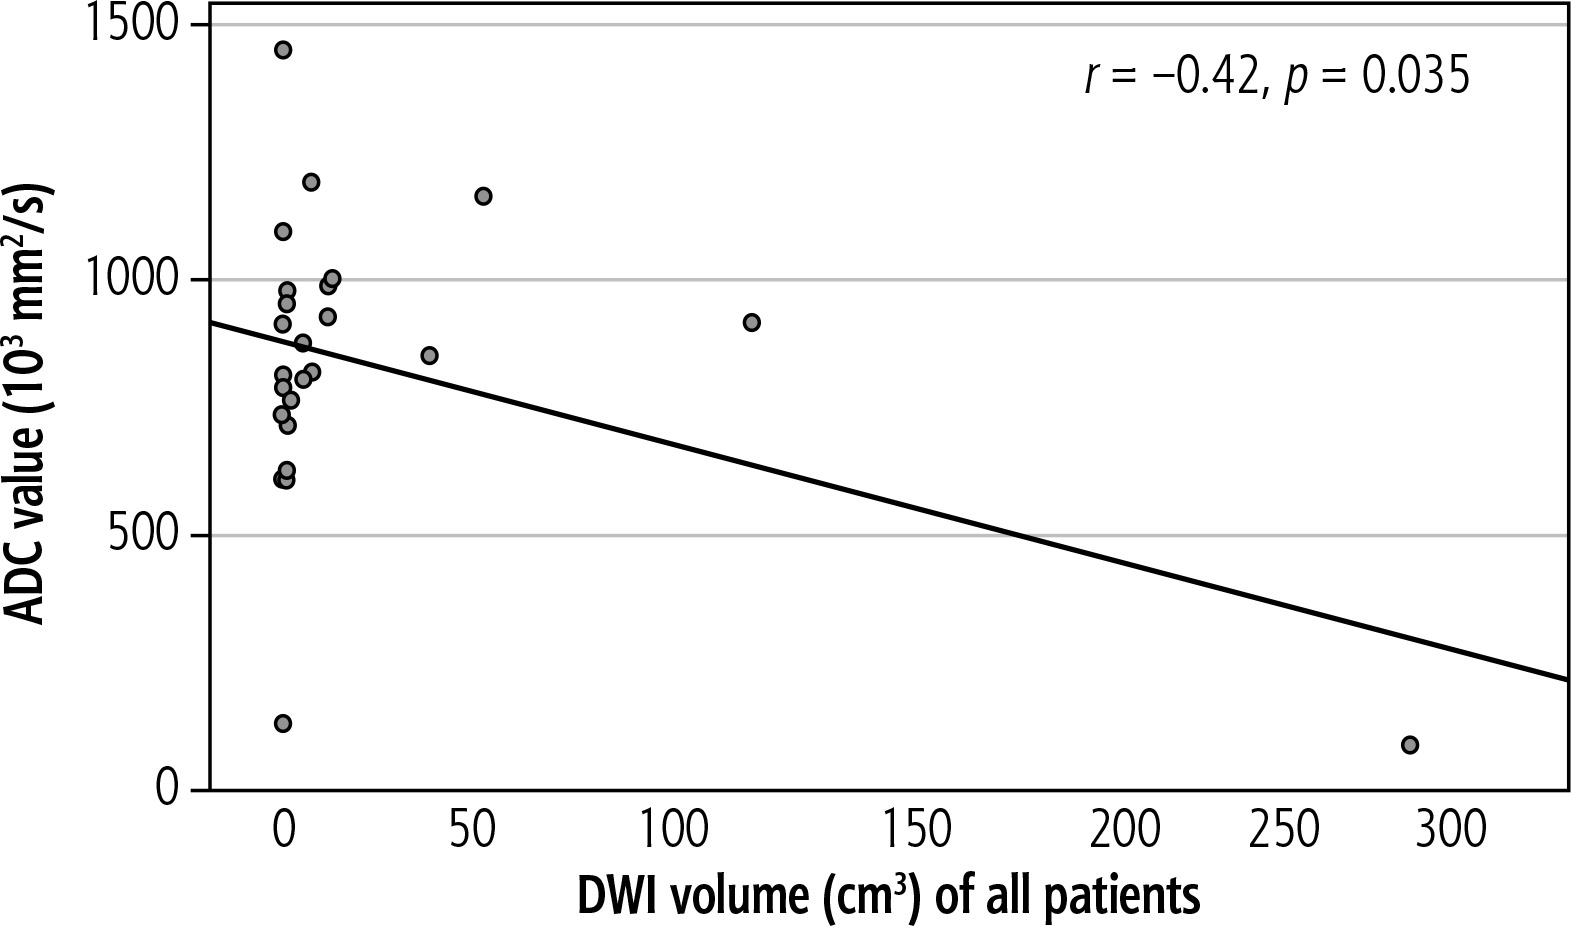
ADC value showed a moderate inverse linear correlation with lesion size (Fig. 2, r = –0.42, p = 0.035). This correlation was stronger in the MVI positive (r = –0.79, p = 0.06) group but was not statistically significant. Neither the MVI negative group (r = 0.089, p = 0.72) nor signal intensity on DWI correlated with lesion size (r = –0.28, p = 0.171).
Quantitative analysis
Overall, there were no statistically significant differences between the sizes of HCC on DWI at b-values up to 1000 s/mm2 and on c-DWI with a higher b-value of 1000 s/mm2 (Table 4). HCC lesions measured in DWI images were statistically significantly larger compared to c-DWI images starting from a b-value of 2000 s/mm2 (DWI vs. c-DWI b 2000 s/mm2: 2 cm3 [1-12] cm3 vs. 1 cm3 [0-17] cm3, p < 0.05). HCC on c-DWI images at high b-values of 4000 and 5000 s/mm2 were not measurable due to poor image quality.
Table 4
Volumetric analysis between acquired and computed diffusion-weighted imaging (c-DWI) according to microvascular invasion (MVI) status
Qualitative analysis
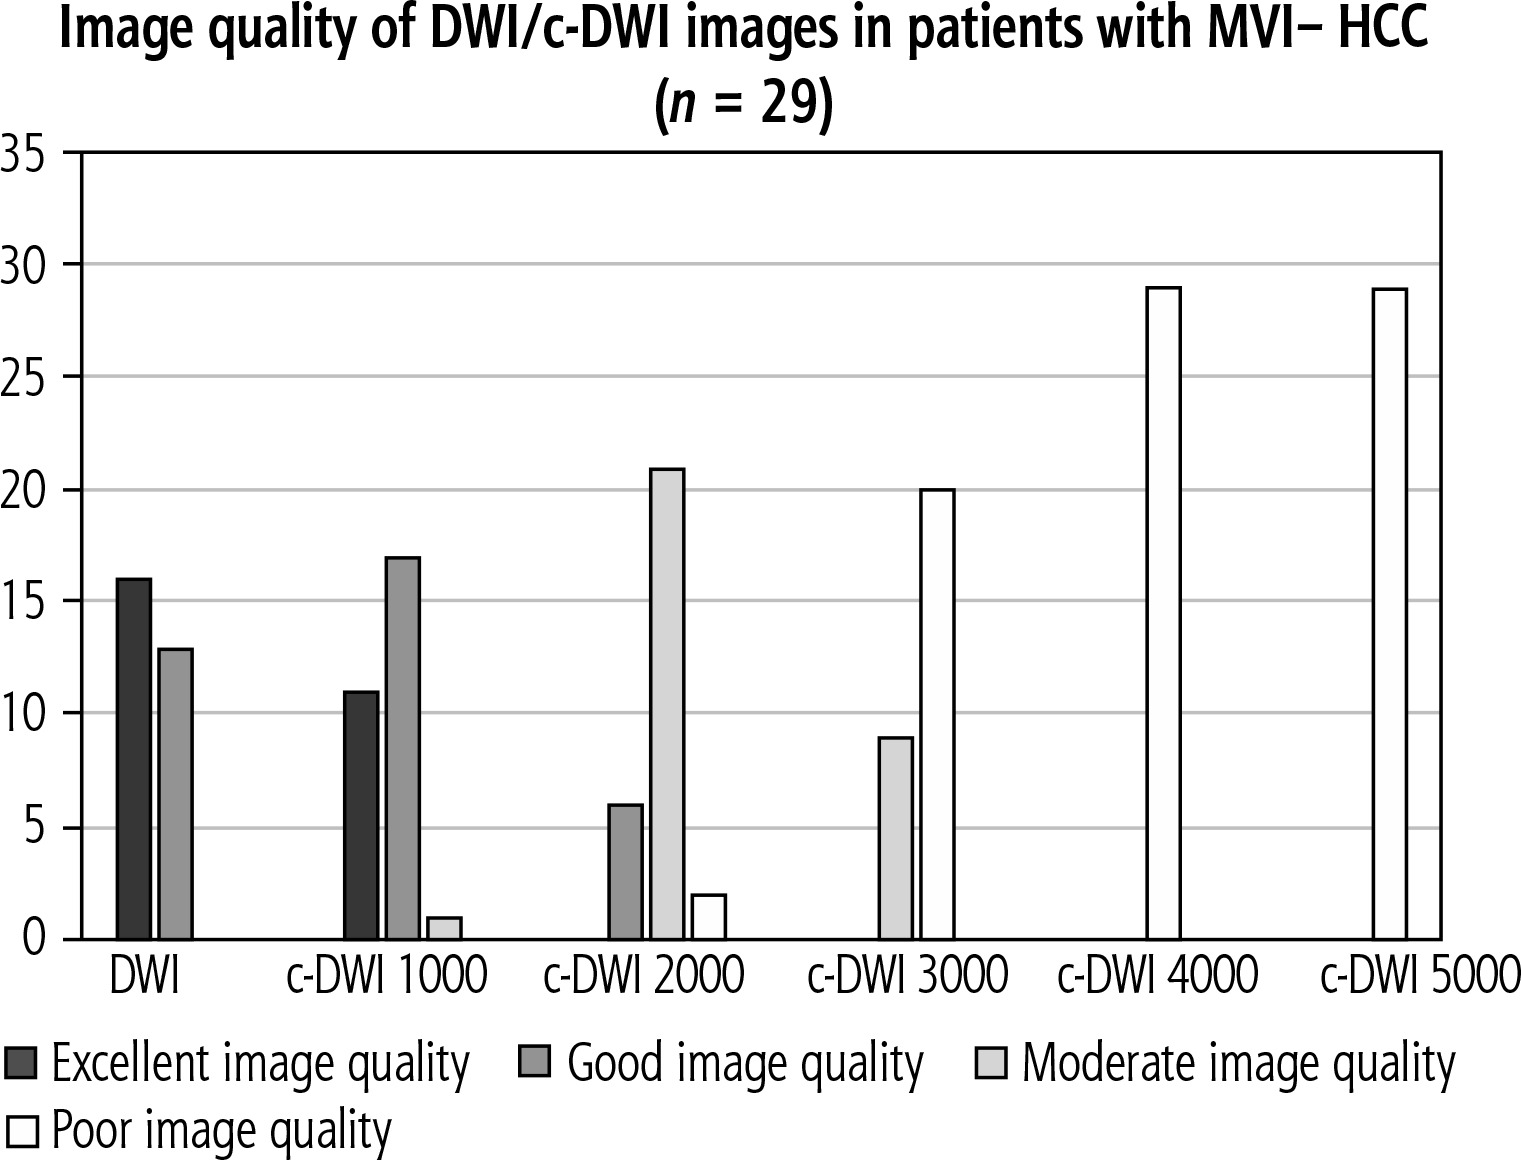
Altogether, there were no significant difference in terms of lesion signal intensity in DWI and c-DWI images at higher b-values in all HCC as well as MVI+. Regarding image quality, however, there was a statistically significant reduction in image quality starting at a high b-value of 2000 s/mm2 in either the MVI+ (Fig. 3, number of images with excellent quality: DWI vs. b 2000 s/mm2: 4 (50%) vs. 1 (12.5%), p = 0.02) or the MVI-group (Fig. 4, number of images with excellent quality: DWI vs. b 2000 s/mm2: 16 (55%) vs. 6 (21%), p < 0.01). The DWI and c-DWI images with a high b-value of 1000 showed no significant difference.
Fig. 3
Bar graph showing the number of images with acceptable image quality in diffusion-weighted imaging (DWI)/computed diffusion-weighted imaging (c-DWI) with b values of 800-5000 s/mm2. There were no significant differences between DWI and c-DWI at b 1000s/mm2. C-DWI at b 1000s/mm2 showed fewer excellent but more good images compared to DWI. However, there was statistically significant deterioration of image quality starting at b = 2000 s/mm2
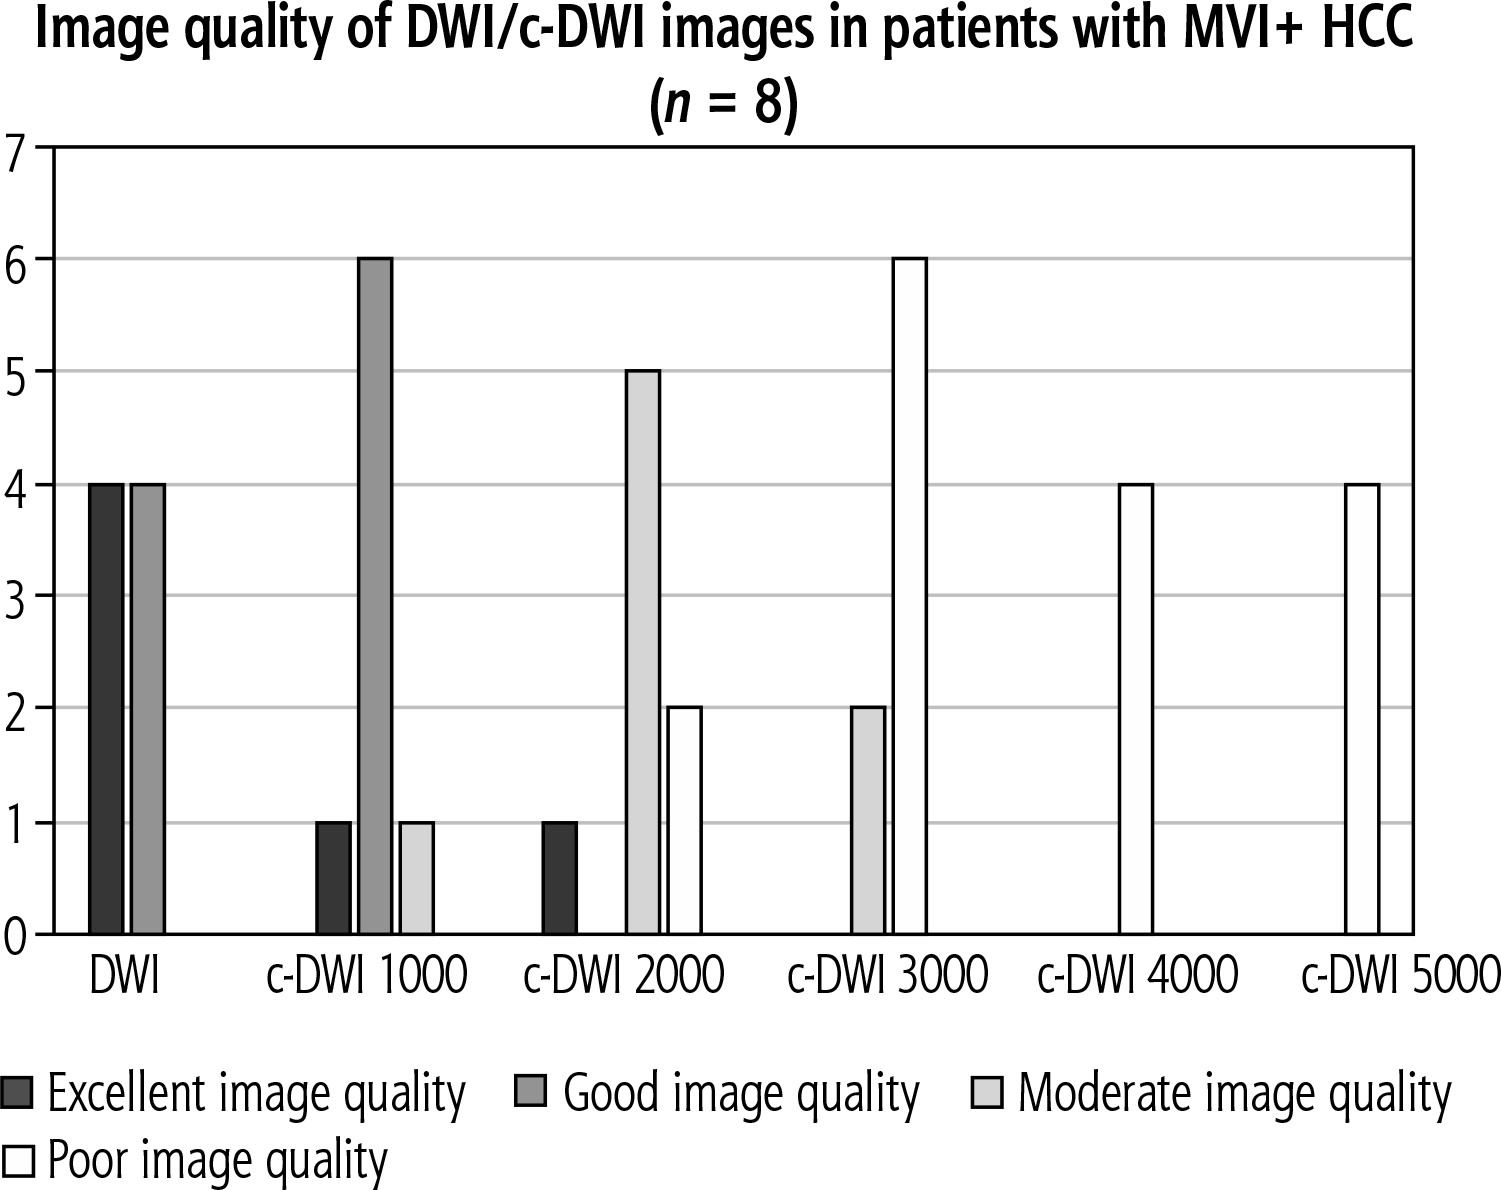
Fig. 4
Bar graph showing the number of images with acceptable image quality in diffusion-weighted imaging (DWI)/computed diffusion-weighted imaging (c-DWI) with b values of 800-5000 s/mm2. There were no significant differences between DWI and c-DWI at 1000 s/mm2. However, there was a statistically significant increase in moderate and poor image quality starting at b = 2000 s/mm2
Discussion
The present study investigated the possible diagnostic benefit of high b-value c-DWI in patients with HCC. There is no doubt that DWI provides insight into tumor microstructure and is associated with histopathology features [1]. Yet, there is still little knowledge beyond the clinical employed DWI with high b-values up to 800 to 1000 s/mm2, which were also recommended to be used in a recent guideline [17]. Notably, ADC values can help to discriminate between benign and malignant liver lesions [18], although there is a considerable overlap between the groups and partially inconclusive results [19].
These limitations of DWI have led to the development of c-DWI, which theoretically could overcome some of them, as the T2 shine-through effect on high b-value images is reduced or even removed from the images [15]. Moreover, the effect of higher tumor cellularity on the signal intensity of the DWI is greater on b-value images above 1500 s/mm2 due to kurtosis effects [15]. In the clinical routine of prostate cancer, it is recommended to obtain a DWI image with a b-value above 1000 s/mm2 to increase the diagnostic accuracy of the MRI [17].
Promising results of high b-value DWI have also been identified for c-DWI throughout various tumor entities including pancreatic, gallbladder, breast and prostate cancer [10, 20-22]. Especially the flexibility to adjust the b-value with c-DWI was reported as a positive aspect of c-DWI [22]. This aspect of c-DWI is only confirmed up to 2000 s/mm2 according to our results as the image quality deteriorates rapidly beyond this value. The quality of the DWI images varies significantly in accordance with the employed b-values. Kaya et al. investigated 124 hepatic lesions with DWI using 7 b-values ranging from 0 to 1000 s/mm2 and suggested the pair of 0 and 800 s/mm2 as the best one [23]. Another study investigated different ADC values from b-value pairs out of 400, 800, 1600 and 2000 s/mm2 in primary tumors and metastasis [24]. However, no statistically significant differences were found between the investigated groups [24].
Regarding prostate cancer, there are promising data indicating that the calculated high b-value image is as good as the acquired one, demonstrated in a recent study employing b-values of 2000 s/mm2 [25]. Notably, some authors even identified that the c-DWI image with a b-value of 2000 s/mm2 could be superior compared to the acquired DWI [26]. For breast cancer, there were similar reports of the clinical benefit of c-DWI, even for very high b-value images up to 2500 s/mm2 [27, 28].
Notably, there is a paucity of data regarding c-DWI in liver MRI. In a recent study of 56 hepatic metastases, the diagnostic benefit of high b-value DWI of 1000 s/mm2 was evaluated [29]. As a key result, the combination of c-DWI and acquired DWI with a b-value of 1000 s/mm2 was superior to the acquired DWI alone [30]. By contrast, in a recent study on hepatic metastasis, high b-value DWI performed only equally to standard acquired DWI with a b-value of 1000 s/mm2 [13]. The present analysis corroborates these previous results with only limited diagnostic potential of high b-value DWI above 1000 s/mm2.
A reason for this finding might be respiratory motion with misalignment of the two acquired b-value sequences, which results in poorer quality of the c-DWI images compared to other body regions such as the brain [12, 15]. Another reason might be cardiac pulsation, which might cause microscopic motion alterations, especially on the high b-value images [15].
Another aspect of the present study was the identification of potential differences regarding high b-value images in accordance with the MVI status. It was clearly observed that MVI positive tumors had a worse prognosis overall, which highlights the importance of this histopathological feature in clinical practice [29-31]. Several studies have investigated the possibility of MRI images to predict the MVI status [32, 33]. Among them, the gadoxetic acid hepatobiliary late phase was analyzed, with very promising results [32,33].
Beyond that, the combination of hypointensity in the hepatobiliary phase with high signal intensity on DWI images could enhance the sensitivity for a correct diagnosis of small HCC lesions. In a previous analysis, hypointensity on late venous phase images with hypointensity on hepatobiliary phase images was demonstrated to enhance the diagnostic accuracy for small HCC lesions [34]. Further trials should investigate the diagnostic accuracy of the combination of DWI findings with hepatobiliary phase hypointensity.
DWI was also identified as very promising to predict MVI status [1]. A recent metaanalysis showed that MVI positive tumors had lower ADC values with a mean of 0.81 × 10⁻³ mm2/s (95% CI: 0.69-0.93) compared to 1.02 × 10⁻³ mm2/s (95% CI: 0.91-1.13) for MVI negative tumors [1]. However, this was only true for ADCmin values and not for ADCmean [1]. One novel aspect of the present study was to evaluate the diagnostic benefit of high b-value DWI for MVI prediction, with overall negative results.
Further research is needed to increase the diagnostic accuracy of MRI images to predict MVI status in HCC patients, presumably using a combination of imaging sequences and quantification methods.
The present analysis is not free from limitations. First, it is a retrospective study prone to inherent bias. To reduce possible bias, the MRI analysis was performed blinded and independently of the histopathology results. Second, the patient sample was small due to strict inclusion criteria to ensure a short time frame between imaging and histopathologic work-up to optimize the correlation between imaging findings and MVI results. Further prospective studies with larger patient samples are needed to validate the present results and determine whether c-DWI could aid in treatment decisions. Third, we could not compare the c-DWI images with actually acquired high b-value images as the current diagnostic gold standard. That is why it is unclear whether acquired high b-value images are superior to standard DWI and c-DWI images.
In conclusion, c-DWI images with high b-values up to b = 1000 s/mm2 demonstrate comparable detectability of HCC with MVI compared to standard DWI. This technique could easily be implemented in clinical practice due to the reduced scan time.
Data and coavailability
Qualified researchers may request access to patient level data and related study documents including the clinical study report, study protocol with any amendments, blank case report form, statistical analysis plan, and dataset specifications. Patient level data will be anonymized and study documents will be redacted to protect the privacy of trial participants.