Personalised fluid therapy is a cornerstone in modern anaesthesiology and intensive care medicine. Given the consistent link between hypervolaemia and unfavourable outcomes in critically ill patients, it is imperative to avoid excessive fluid administration [1, 2]. To achieve this goal, dynamic tests of fluid responsiveness (FR) have been investigated in intensive care [3]. The most frequently utilized indices of FR are stroke volume variation (SVV), pulse pressure variation (PPV), the passive leg raise (PLR) test, the end-expiratory occlusion test (EEOT), tidal volume challenge (VtC), mini-fluid challenge (mFC), and the inferior vena cava collapsibility index (IVC-CI). However, some of these markers are unreliable in patients with arrhythmias, tachycardia, low tidal volumes (< 8 mL kg–1), spontaneous respiratory activity, elevated respiratory rates, low pulmonary compliance, and reduced driving pressures [4, 5]. The superior vena cava respiratory collapsibility index (SVC-CI) avoids some of the above-mentioned limitations. Unlike other dynamic tests, SVC-CI appears to be less dependent on heart rhythm disturbances, pulmonary compliance or low tidal volumes [6, 7]. The SVC-CI can be calculated using upper-oesophageal superior vena cava views using the maximal and minimal SVC diameter from the respiratory cycle:
No meta-analyses assessing the diagnostic performance of SVC-CI have been conducted to date. Consequently, the evidence enabling routine use of SVC-CI in guiding fluid therapy in critical care and perioperative medicine is limited. The primary aim of this systematic search and meta-analysis was thus to present the evidence on the utility of SVC-CI as a marker of fluid responsiveness in anaesthesiology and intensive care medicine.
Methods
Protocol
This systematic review and meta-analysis were carried out following the guidelines of the Preferred Reporting Items for Systematic Reviews and Meta-Analysis (PRISMA) [8]. The protocol was pre-registered in the PROSPERO database (registration number CRD42023461813).
Study selection and inclusion criteria
Studies investigating the utility of SVC-CI in predicting fluid responsiveness and published between 01.01.2000 and 01.06.2023 were considered for this analysis. Only trials conducted in intensive care units or operating rooms and written in English were selected. Preprints, conference abstracts, reviews, editorials and case reports were excluded. No approval from the local bioethics committee for conducting this study was required.
We only included studies that reported the SVC-CI’s sensitivity, specificity, and the percentage of responders to volume expansion. Reporting of other test metrics was not mandatory.
Systematic search and search strategy
Two authors (TK and MM) independently conducted a systematic search of the Medline and EMBASE databases published in the period from 01.01.2000 until 01.06.2023. The search strategy (including search terms and keywords) is described in the PROSPERO review protocol. If disagreement persisted between authors, it was resolved by discussion. In addition to the database search, we cross checked references from the original articles and reviews.
Quality assessment
The same two authors (TK and MM) independently evaluated the quality of each study using the QUADAS-C tool (Quality Assessment of Diagnostic Accuracy Studies). Any differences in assessments were resolved through mutual agreement, and if disagreements persisted, a third researcher (RG) was consulted. For each criterion, the risk of bias was judged as high (3 points), unclear (2 points), or low (1 point), as indicated in the QUADAS-C tool manual [9].
Data extraction
The following set of variables was extracted from each study: first author, year of publication, patient setting, number of patients included, type and dose of fluid used for fluid expansion, modality used for assessing changes in cardiac output, area under the ROC curve (AUC) along with 95% CI, specificity and sensitivity of the test, and suggested cut-off value.
Statistical analysis
Primary data in the form of contingency tables were extracted. Subsequently, metrics including sensitivity, specificity, and the diagnostic odds ratio (DOR) were computed. Forest plots were created to visualize these data. The correlation between sensitivity and specificity was assessed using Spearman rank correlation to investigate any possible threshold effect. The pooled DOR was calculated using Der Simonian and Laird’s univariate random-effect model (DSL) [10]. The performance of SVC-CI was evaluated through bivariate and hierarchical model analysis. A random effect models was employed due to suspected heterogeneity, which is typical of diagnostic test meta-analyses. The model’s AUC and partial AUC were calculated, and summary receiver operating characteristic (SROC) curves were generated. The sensitivity and specificity of the model (based on the calculated operating point of the SROC curve) were presented rather than pooled values, as the latter are deemed to be misleading [11]. Subgroup analyses were also performed to assess any potential impact of confounders (study setting, level of positive end-expiratory pressure [PEEP], method of FR quantification). For each subgroup SROC curves were generated and subsequently compared. Heterogeneity among trials was assessed using Cochran’s Q test, and its extent was quantified by calculating the inconsistency (I2). An I2 value exceeding 50% was deemed indicative of heterogeneity. The P-value < 0.05 was assumed significant. Data analysis was performed using R software v.4.3.1, along with the mada package.
Results
Results of the systematic search and quality assessment
The results of the systematic search are shown in the PRISMA flowchart in Figure 1. Nine studies focusing on SVC-CI as a predictor of FR were retrieved. One study was excluded from the meta-analysis due to a high risk of bias caused by the measurement of changes in SVV instead of the measurement of direct trends in cardiac output for estimation of fluid responsiveness [12]. The studies included in the meta-analysis are presented in Table 1 [6, 7, 12–18]. The quality assessment of each study is presented in Supplementary Figure 1.
FIGURE 1
PRISMA systematic search flow diagram for SVC-CI as an indicator of fluid responsiveness [8]
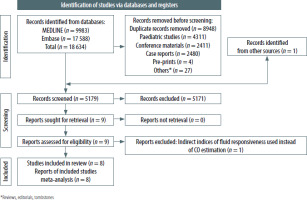
TABLE 1
Summary of the studies included in the meta-analysis
In the majority of studies only one SVC-CI trial per patient was performed, except for the study by Bubenek-Turconi et al. [17]. Analyses were therefore based on 1083 SVC-CI test trials performed on 857 patients. Three of the studies were conducted in an intra-operative setting, and the rest took place in intensive care units. In most of the studies, the triggers for SVC-CI assessment with the volume expansion trial were hypotension and hypoperfusion symptoms including metabolic acidosis, elevated lactate levels, decreased central venous saturation (ScvO2 < 70%), and skin mottling. In three studies, SVC-CI was assessed in every patient, without any prespecified trigger [13, 14, 16].
Extracted data
The data extracted from eight studies are presented in Table 2. A primary extraction form with a more extended dataset can be obtained from the authors upon request.
TABLE 2
Summary of sensitivity, specificity and diagnostic odds ratio (DOR) with their 95% confidence intervals of the included studies
Meta-analysis
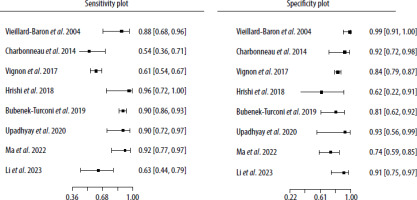
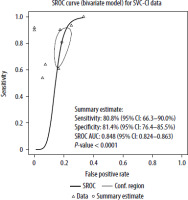
Forest plots of both the sensitivity and specificity per study are shown in Figure 2, and raw data are presented in Table 2. The sensitivity and specificity of the SVC-CI operating point for detecting FR assessed by the bivariate model by Reitsma was 80.8% (95% CI: 66.3–90%) and 81.4% (95% CI: 76.4–85.5%), respectively. The estimates of I2 did not show significant heterogeneity across the included studies (Zhou and Dendukuri approach: I2 = 0%, Holling sample size adjusted approaches: I2 = 5.3–7.8%).
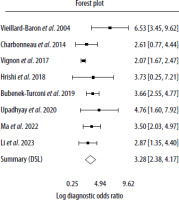
The correlation between sensitivities and false positive rates was assessed using the Spearman rank correlation with rho 0.429 (95% CI: –0.396 to 0.870). The fitted DOR evaluated by the DSL model was 26.48 (95% CI: 10.78–65.04). Figure 3 shows a forest plot of logDOR assessed by the DSL model. The AUC of the bivariate model for SVC-CI was 0.848 (95% CI: 0.824–0.863) with P < 0.001. The partial AUC (pAUC) accounted for 0.562. A summary ROC (SROC) curve derived from the described model is presented in Figure 4.
Subgroup analysis
We also conducted subgroup analyses to investigate confounders, such as the type of preload augmentation method (colloid vs non-colloid or PLR), the modality of cardiac output estimation (trans-oesophageal echocardiography [TOE] vs. other modalities including transthoracic echocardiography [TTE] or pulse contour analysis methods), the patient setting (operating room vs. intensive care unit) and the level of PEEP (PEEP ≤ 5 cm H2O vs. > 5 cm H2O). No differences between studies were noted when comparing subgroups of patients who were treated in the ICU and in the OR (under general anaesthesia). The performance of SVC-CI in the ICU cohort was comparable to the whole study group with AUC of 0.845, with 78.5% sensitivity and 81.5% specifi-city. Similarly, the use of colloids versus non-colloids (crystalloids and PLR) showed no significant impact on the parameter metrics. In patients with higher levels of PEEP (> 5 cm H2O), SVC-CI showed a significantly worse diagnostic performance compared to their counterparts with low PEEP levels (χ2 = 7.753, df = 2, P = 0.0207). While test specificity in both groups was comparable, in the high-PEEP group the sensitivity of SVC-CI was markedly lower (60.2% vs. 87.4%). The summary ROC curves for this comparison are presented in Figure 5. The outcomes of these comparative analyses as well as a comparison of SROC curves are presented in Table 3.
FIGURE 5
Comparison of summary ROC curves according to the applied level of PEEP (high-PEEP vs. low-PEEP groups)
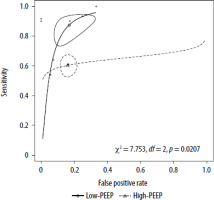
TABLE 3
Subgroup analysis and summary receiver operator curve (SROC) comparison
Discussion
Our results demonstrate the clinical utility of SVC-CI given that it has sensitivity and specificity for detecting fluid responsiveness of 80.8% and 81.4%, respectively. This is in line with visual assessment of the summary of the studies we analysed (Table 1), where seven of them were positive. In a study by Charboneau et al. [6] that produced negative results, SVC-CI was assessed by the calculation of area respiratory collapsibility, which might have influenced the study outcomes. Therefore, such an approach cannot be recommended: in fact, only SVC-CI calculated from SVC diameters is able to precisely assess fluid responsiveness. Although the clinical heterogeneity of the studies included is evident, we found no significant statistical heterogeneity or threshold effect across the included studies, which adds robustness to our meta-analysis. This consistency highlights the reliability of SVC-CI as a diagnostic tool, making it applicable in a variety of clinical scenarios. Another factor that confirms the applicability of this study is that there were no differences between subgroups, in terms of study setting (ICU vs. OR) or the types of fluids used for fluid expansion.
When comparing the diagnostic capabilities of SVC-CI observed in our study with other predictors of fluid responsiveness as presented in a recent meta-analysis by Alvarado Sanchez et al. [19], SVC-CI performs comparably to most known dynamic predictors of FR, such as PPV, which reaches an AUC of 0.84, SVV (AUC 0.83), EEOT (AUC 0.83) and PLR (AUC 0.83). Earlier meta-analyses reported significantly higher AUC values of SVV, PPV and EEOT, in the range 0.90–0.95 [4, 20]. However, some of these meta-analyses employed univariate models for the diagnostic test evaluation, which are no longer recommended by the Cochrane Collaboration [21]. Thus, these studies should not be compared with meta-analyses using hierarchical and bivariate approaches [22].
As the assessment of FR using SVC-CI presents similar discriminatory properties to the other tests of FR, the target populations for the application of SVC-CI differ. First, SVC-CI has been validated under laparotomy conditions [12], where IVC-CI and PLR cannot be performed due to technical reasons and where SVV or PPV have not been sufficiently validated [17]. Several authors have questioned the validity of PPV, SVV or VtC during laparotomy [23–25]. SVC-CI also allows for rapid FR assessment, unlike EEOT, which requires a cardiac output measurement modality with more time consuming and invasive cannulation procedures. Furthermore, TOE is a less invasive modality than thermodilution methods, yet more precise than uncalibrated pulse contour analysis methods, especially in haemodynamically unstable patients [26, 27]. Although the potential for complications associated with the use of TOE is not to be understated, it seems that the frequency of severe complications remains lower than the use of transpulmonary thermodilution (TPTD). Large series of patients monitored with TPTD demonstrated 0.2–0.4% frequency of severe complications (limb ischemia, femoral artery thrombosis), whereas the rate of severe complications linked to perioperative use of TOE was 0.06–0.08% (upper gastro-intestinal bleeding, gastric or oesophageal tears) [28–30]. Secondly, both SVC-CI and IVC-CI can be used in patients with arrhythmias in whom predictors of FR such as SVV, PPV, VtC or EEOT cannot be utilised [31]. In the study by Vignon et al. [7] about 80% of the study population (mechanically ventilated critically ill patients) presented at least one clinical condition precluding the use of the above-mentioned predictors which are based on pulse contour analysis. Those conditions included: a non-sinus rhythm, intraabdominal hypertension or tidal volumes < 8 mL kg–1. In this subset of patients, the specificity and sensitivity of SVC-CI remained high. Furthermore, the performance of SVC-CI in Vignon’s study was statistically significantly more precise than that of IVC-CI and delta-pulse pressure. In addition, Charboneau et al. [6] reported that the presence of low Vt as well as low heart and respiratory rates did not influence the performance of SVC-CI. However, the authors raised concerns that high PEEP and high respiratory rates may impair the diagnostic precision of the test, by embedding direct pressure on the extrapericardial part of the superior vena cava. Due to the varying reporting practices of setting PEEP values in the studies (a standard level of PEEP per protocol or open-label use), we did not perform meta-regression analyses to assess its impact on the prognostic performance of SVC-CI. Instead, we compared studies with higher levels of PEEP (>5 mm H2O) with the remaining studies (low PEEP group). The use of higher levels of PEEP was associated with a significantly lower diagnostic performance of SVC-CI, which may be attributed to low sensitivity (60.2% vs. 90.2%). How-ever, none of the studies that used higher PEEP values were designed to investigate SVC-CI under these conditions. Therefore, it remains unclear whether this observation is true or it is a result of inter-study heterogeneity or the impact of other confounders. Lastly, the concomitant use of TOE for assessment of SVC-CI enables physicians to rapidly evaluate causes of acute hypoxia or shock [32]. Considering the differences between the various methods, we believe that SVC-CI may be useful in a selected cohort of patients who require assessment of FR in specific clinical scenarios. This population predominantly includes patients undergoing laparotomy in the OR, where TPTD methods are not routinely available and where PPV, SVV or VtC frequently cannot be utilised due to patient characteristics [33]. On the other hand, the use of SVC-CI in ICU patients seems limited due to the frequent use of levels of PEEP exceeding 5 cm H2O. In such patients EEOT seems to be the most suitable test, as its diagnostic performance improves along with an increase in PEEP values [34, 35]. Thus, those patients presenting for acute laparotomy and elective open aortic surgery would be suitable for a fluid therapy guided by SVC-CI. This is due to the fact that tests based on uncalibrated pulse contour analysis (SVV, VtC, mFC or FC) seem to be unreliable in the setting of low cardiac output states, dynamic changes of systematic vascular resistance or excessive systematic vasoconstriction conditions and during aortic cross-clamping [36–39]. Furthermore, as the use of TOE for haemodynamic monitoring during open aortic procedures is recommended by the American Society of Anesthesiologists Task Force on Transesophageal Echocardiography, the use of SVC-CI could then be incorporated into the monitoring protocol [32]. Given the questionable validation and numerous limitations of SVV and PPV under laparotomy conditions, along with the limitations of pulse contour analysis methods during aortic cross clamping and technical aspects that exclude the use of PLR and IVC-CI, we postulate that SVC-CI and mFC remain the only two viable options for the assessment of FR during open abdominal aortic surgery.
Limitations
There are several limitations of our study. First, the number of studies included was low, although the number of included patients was comparable to robust meta-analyses cited in this paper. The risk of bias across the studies was high. Secondly, even though no statistical inter-study heterogeneity was observed, the variations in patient populations, clinical settings and study protocols among the included studies indicate clinical heterogeneity. Another source of uncertainty is that measuring SVC-CI is highly operator dependent and in three included studies SVC-CI was not assessed using a reference method [6, 16, 17]. Moreover, most of the studies analysed SVC-CI at tidal volumes (Vt) close to 8 mL kg–1, and only Charboneau et al. [6] performed a subgroup analysis in patients with lower Vt.
Although the estimated accuracy of SVC-CI for the prediction of FR appeared similar to the whole study group, more data are needed to definitively confirm the clinical utility of SVC-CI for guiding fluid therapy in mechanically ventilated patients with low tidal volumes, higher than > 5 cm H2O PEEP and under specific conditions such as respiratory failure or aortic cross clamping.
Conclusions
The results of our meta-analysis confirm that SVC-CI can be applied for predicting FR with high sensitivity and specificity. We recommend caution when using SVC-CI in mechanically ventilated patients with higher levels of PEEP, due to possible low test sensitivity and an increased risk of false negative cases. The SVC-CI based fluid therapy would seem suitable for patients undergoing laparotomy and open abdominal aortic surgery, given the limitations of other FR assessment methods.


